California's 29th congressional district
| California's 29th congressional district | |||
|---|---|---|---|
 California's 29th congressional district since January 3, 2013 | |||
| U.S. Representative |
| ||
| Median income | $53,347[1] | ||
| Ethnicity |
| ||
| Cook PVI | D+29[3] | ||
California's 29th congressional district is a congressional district in the U.S. state of California based in the north central San Fernando Valley, it includes the city of San Fernando as well as the Los Angeles communities of Van Nuys, Pacoima, Arleta, Panorama City, Sylmar and parts of Sun Valley and North Hollywood. The district is represented by Democrat Tony Cárdenas.
.mw-parser-output .toclimit-2 .toclevel-1 ul,.mw-parser-output .toclimit-3 .toclevel-2 ul,.mw-parser-output .toclimit-4 .toclevel-3 ul,.mw-parser-output .toclimit-5 .toclevel-4 ul,.mw-parser-output .toclimit-6 .toclevel-5 ul,.mw-parser-output .toclimit-7 .toclevel-6 ul{display:none}
Contents
1 Competitiveness
1.1 In statewide races
2 List of members representing the district
3 Election results
3.1 1952
3.2 1954
3.3 1956
3.4 1958
3.5 1960
3.6 1962
3.7 1964
3.8 1966
3.9 1968
3.10 1970
3.11 1972
3.12 1974
3.13 1976
3.14 1978
3.15 1980
3.16 1982
3.17 1984
3.18 1986
3.19 1988
3.20 1990
3.21 1992
3.22 1994
3.23 1996
3.24 1998
3.25 2000
3.26 2002
3.27 2004
3.28 2006
3.29 2008
3.30 2010
3.31 2012
3.32 2014
3.33 2016
3.34 2018
4 Living former representatives
5 Historical district boundaries
6 See also
7 References
8 External links
Competitiveness
In statewide races
| Election results from statewide races | ||
|---|---|---|
| Year | Office | Results |
| 1990 | Governor[4] | Feinstein 74.3% - 22.2% |
| 1992 | President[5] | Clinton 66.3% - 20.2% |
Senator[6] | Boxer 67.7% - 27.4% | |
Senator (Special)[7] | Feinstein 72.6% - 23.6% | |
| 1994 | Governor[8] | Brown 55.6% - 41.1% |
Senator[9] | Feinstein 69.4% - 26.0% | |
| 1996 | President[10] | Clinton 66.5% - 23.5% |
| 1998 | Governor[11] | Davis 73.8% - 22.6% |
Senator[12] | Boxer 70.9% - 26.7% | |
| 2000 | President[13] | Gore 72.1% - 22.3% |
Senator[14] | Feinstein 70.5% - 21.2% | |
| 2002 | Governor[15] | Davis 52.2% - 38.7% |
| 2003 | Recall[16][17] | |
Schwarzenegger 47.1% - 33.6% | ||
| 2004 | President[18] | Kerry 61.2% - 37.4% |
Senator[19] | Boxer 63.8% - 31.4% | |
| 2006 | Governor[20] | Schwarzenegger 50.3% - 44.4% |
Senator[21] | Feinstein 64.0% - 30.7% | |
| 2008 | President[22] | Obama 67.6% - 30.4% |
| 2010 | Governor[23] | Brown 61.0% - 34.5% |
Senator[24] | Boxer 60.7% - 34.8% | |
| 2012 | President[25] | Obama 77.0% - 20.5% |
Senator[26] | Feinstein 77.8% - 22.2% | |
| 2014 | Governor[27] | Brown 73.8% – 26.2% |
| 2016 | President[28] | Clinton 77.7% - 16.8% |
Senator[29] | Harris 53.9% - 47.0% | |
| 2018 | Governor[30] | Newsom 77.8% – 22.2% |
Senator[31] | Feinstein 55.0% – 45.0% | |
List of members representing the district
District created January 3, 1953
| Representative | Party | Dates | Cong ress(es) | Electoral history | Counties |
|---|---|---|---|---|---|
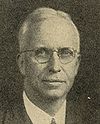 John J. Phillips | Republican | January 3, 1953 – January 3, 1957 | 83rd 84th | Redistricted from the 22nd district and re-elected in 1952. Re-elected in 1954. Retired. | Imperial, Riverside |
 Dalip Singh Saund | Democratic | January 3, 1957 – January 3, 1963 | 85th 86th 87th | First Sikh Congressman Elected in 1956. Re-elected in 1958. Re-elected in 1960. Left office due to incapacitating stroke | Imperial, Riverside |
 George E. Brown, Jr. | Democratic | January 3, 1963 – January 3, 1971 | 88th 89th 90th 91st | Elected in 1962. Re-elected in 1964. Re-elected in 1966. Re-elected in 1968. Retired to run for the US Senate | Los Angeles |
 George E. Danielson | Democratic | January 3, 1971 – January 3, 1975 | 92nd 93rd | Elected in 1970. Re-elected in 1972. Redistricted to the 30th district | |
 Augustus Hawkins | Democratic | January 3, 1975 – January 3, 1983 | 94th 95th 96th 97th | Redistricted from the 21st district and re-elected in 1974. Re-elected in 1976. Re-elected in 1978. Re-elected in 1980. | |
| January 3, 1983 – January 3, 1991 | 98th 99th 100th 101st | Re-elected in 1982. Re-elected in 1984. Re-elected in 1986. Re-elected in 1988. Retired | South Central Los Angeles | ||
 Maxine Waters | Democratic | January 3, 1991 – January 3, 1993 | 102nd | Elected in 1990. Redistricted to the 35th district | |
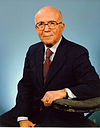
 Henry Waxman | Democratic | January 3, 1993 – January 3, 2003 | 103rd 104th 105th 106th 107th | Redistricted from the 24th district and re-elected in 1992. Re-elected in 1994. Re-elected in 1996. Re-elected in 1998. Re-elected in 2000. Redistricted to the 30th district | West Side Los Angeles |
 Adam Schiff | Democratic | January 3, 2003 – January 3, 2013 | 108th 109th 110th 111th 112th | Redistricted from the 27th district and re-elected in 2002. Re-elected in 2004. Re-elected in 2006. Re-elected in 2008. Re-elected in 2010. Redistricted to the 28th district | Los Angeles (Burbank, Glendale, Pasadena) |
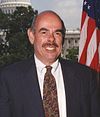
 Tony Cárdenas | Democratic | January 3, 2013 – present | 113th 114th 115th 116th | Elected in 2012. Re-elected in 2014. Re-elected in 2016. Re-elected in 2018. | North Central San Fernando Valley |
Election results
1952 • 1954 • 1956 • 1958 • 1960 • 1962 • 1964 • 1966 • 1968 • 1970 • 1972 • 1974 • 1976 • 1978 • 1980 • 1982 • 1984 • 1986 • 1988 • 1990 • 1992 • 1994 • 1996 • 1998 • 2000 • 2002 • 2004 • 2006 • 2010 • 2012 • 2014 • 2016 |
1952
| Party | Candidate | Votes | % | |
|---|---|---|---|---|
Republican | John J. Phillips (incumbent) | 73,144 | 100.0 | |
Turnout | ||||
Republican hold | ||||
1954
| Party | Candidate | Votes | % | |
|---|---|---|---|---|
Republican | John J. Phillips (incumbent) | 42,420 | 58.0 | |
Democratic | Bruce Shangle | 30,781 | 42.0 | |
| Total votes | 73,201 | 100.0 | ||
Turnout | ||||
Republican hold | ||||
1956
| Party | Candidate | Votes | % | |||
|---|---|---|---|---|---|---|
Democratic | Dalip Singh Saund | 54,989 | 51.5 | |||
Republican | Jacqueline Cochran Odlum | 51,690 | 48.5 | |||
| Total votes | 106,679 | 100.0 | ||||
Turnout | ||||||
Democratic gain from Republican | ||||||
1958
| Party | Candidate | Votes | % | |
|---|---|---|---|---|
Democratic | Dalip Singh Saund (incumbent) | 64,518 | 62.4 | |
Republican | John Babbage | 38,899 | 37.6 | |
| Total votes | 103,417 | 100.0 | ||
Turnout | ||||
Democratic hold | ||||
1960
| Party | Candidate | Votes | % | |
|---|---|---|---|---|
Democratic | Dalip Singh Saund (incumbent) | 76,139 | 57.1 | |
Republican | Charles H. Jameson | 57,319 | 42.9 | |
| Total votes | 133,458 | 100.0 | ||
Turnout | ||||
Democratic hold | ||||
1962
| Party | Candidate | Votes | % | |
|---|---|---|---|---|
Democratic | George Brown, Jr. | 73,740 | 55.7 | |
Republican | H. L. Richardson, Jr. | 58,760 | 44.3 | |
| Total votes | 132,500 | 100.0 | ||
Turnout | ||||
Democratic hold | ||||
1964
| Party | Candidate | Votes | % | |
|---|---|---|---|---|
Democratic | George Brown, Jr. (incumbent) | 90,208 | 58.6 | |
Republican | Charles J. Farrington, Jr. | 63,836 | 41.4 | |
| Total votes | 154,044 | 100.0 | ||
Turnout | ||||
Democratic hold | ||||
1966
| Party | Candidate | Votes | % | |
|---|---|---|---|---|
Democratic | George Brown, Jr. (incumbent) | 69,115 | 51.1 | |
Republican | Bill Orozco | 66,079 | 48.9 | |
| Total votes | 135,194 | 100.0 | ||
Turnout | ||||
Democratic hold | ||||
1968
| Party | Candidate | Votes | % | |
|---|---|---|---|---|
Democratic | George Brown, Jr. (incumbent) | 74,807 | 52.3 | |
Republican | Bill Orozco | 68,213 | 47.7 | |
| Total votes | 143,020 | 100.0 | ||
Turnout | ||||
Democratic hold | ||||
1970
| Party | Candidate | Votes | % | |
|---|---|---|---|---|
Democratic | George E. Danielson | 71,308 | 62.6 | |
Republican | Tom McMann | 42,620 | 37.4 | |
| Total votes | 113,928 | 100.0 | ||
Turnout | ||||
Democratic hold | ||||
1972
| Party | Candidate | Votes | % | |
|---|---|---|---|---|
Democratic | George E. Danielson (incumbent) | 91,553 | 62.8 | |
Republican | Richard E. Ferraro | 48,814 | 33.5 | |
Peace and Freedom | John W. Blaine | 5,455 | 3.7 | |
| Total votes | 145,822 | 100.0 | ||
Turnout | ||||
Democratic hold | ||||
1974
| Party | Candidate | Votes | % | |
|---|---|---|---|---|
Democratic | Augustus F. Hawkins (incumbent) | 45,977 | 100.0 | |
Turnout | ||||
Democratic hold | ||||
1976
| Party | Candidate | Votes | % | |
|---|---|---|---|---|
Democratic | Augustus F. Hawkins (incumbent) | 82,515 | 85.5 | |
Republican | Michael D. Germonprez | 10,852 | 11.2 | |
Independent | Sheila Leburg | 3,235 | 3.3 | |
| Total votes | 96,602 | 100.0 | ||
Turnout | ||||
Democratic hold | ||||
1978
| Party | Candidate | Votes | % | |
|---|---|---|---|---|
Democratic | Augustus F. Hawkins (incumbent) | 65,214 | 85.0 | |
Republican | Uriah J. Fields | 11,512 | 15.0 | |
| Total votes | 76,726 | 100.0 | ||
Turnout | ||||
Democratic hold | ||||
1980
| Party | Candidate | Votes | % | |
|---|---|---|---|---|
Democratic | Augustus F. Hawkins (incumbent) | 80,095 | 86.1 | |
Republican | Michael Arthur Hirt | 10,282 | 11.1 | |
Libertarian | Earl Smith | 2,622 | 2.8 | |
| Total votes | 92,999 | 100.0 | ||
Turnout | ||||
Democratic hold | ||||
1982
| Party | Candidate | Votes | % | |
|---|---|---|---|---|
Democratic | Augustus F. Hawkins (incumbent) | 97,028 | 79.8 | |
Republican | Milton R. Mackaig | 24,568 | 20.2 | |
| Total votes | 121,596 | 100.0 | ||
Turnout | ||||
Democratic hold | ||||
1984
| Party | Candidate | Votes | % | |
|---|---|---|---|---|
Democratic | Augustus F. Hawkins (incumbent) | 108,777 | 86.6 | |
Republican | Echo Y. Goto | 16,781 | 13.4 | |
| Total votes | 125,558 | 100.0 | ||
Turnout | ||||
Democratic hold | ||||
1986
| Party | Candidate | Votes | % | |
|---|---|---|---|---|
Democratic | Augustus F. Hawkins (incumbent) | 78,132 | 84.6 | |
Republican | John Van de Brooke | 13,432 | 14.5 | |
Libertarian | Waheed R. Boctor | 851 | 0.9 | |
| Total votes | 92,415 | 100.0 | ||
Turnout | ||||
Democratic hold | ||||
1988
| Party | Candidate | Votes | % | |
|---|---|---|---|---|
Democratic | Augustus F. Hawkins (incumbent) | 88,169 | 82.8 | |
Republican | Reuben D. Franco | 14,543 | 13.7 | |
Libertarian | Gregory P. Gilmore | 3,724 | 3.5 | |
| Total votes | 105,436 | 100.0 | ||
Turnout | ||||
Democratic hold | ||||
1990
| Party | Candidate | Votes | % | |
|---|---|---|---|---|
Democratic | Maxine Waters | 51,350 | 79.4 | |
Republican | Bill DeWitt | 12,054 | 18.6 | |
Libertarian | Waheed R. Boctor | 1,268 | 2.0 | |
| Total votes | 64,672 | 100.0 | ||
Turnout | ||||
Democratic hold | ||||
1992
| Party | Candidate | Votes | % | |
|---|---|---|---|---|
Democratic | Henry Waxman (incumbent) | 160,312 | 61.3 | |
Republican | Mark Robbins | 67,141 | 25.7 | |
Independent | David Davis | 15,445 | 5.9 | |
Peace and Freedom | Susan C. Davies | 13,888 | 5.3 | |
Libertarian | Felix Tsvi Rogin | 4,699 | 1.8 | |
Independent | Vann (write-in) | 1 | 0.0 | |
| Total votes | 261,486 | 100.0 | ||
Turnout | ||||
Democratic hold | ||||
1994
| Party | Candidate | Votes | % | |
|---|---|---|---|---|
Democratic | Henry Waxman (incumbent) | 129,413 | 66.1 | |
Republican | Paul Stepanek | 53,801 | 28.1 | |
Libertarian | Mike Binkley | 7,162 | 3.8 | |
| Total votes | 190,376 | 100.0 | ||
Turnout | ||||
Democratic hold | ||||
1996
| Party | Candidate | Votes | % | |
|---|---|---|---|---|
Democratic | Henry Waxman (incumbent) | 145,278 | 67.7 | |
Republican | Paul Stepanek | 52,857 | 24.6 | |
Peace and Freedom | John Daley | 8,819 | 4.1 | |
Libertarian | Mike Binkley | 4,766 | 2.2 | |
Natural Law | Brian Rees | 3,097 | 1.4 | |
| Total votes | 214,817 | 100.0 | ||
Turnout | ||||
Democratic hold | ||||
1998
| Party | Candidate | Votes | % | |
|---|---|---|---|---|
Democratic | Henry Waxman (incumbent) | 131,561 | 73.9 | |
Republican | Mike Gottlieb | 40,282 | 22.6 | |
Libertarian | Mike Binkley | 3,534 | 2.0 | |
Natural Law | Karen Blasdell-Wilkinson | 2,717 | 1.5 | |
| Total votes | 178,094 | 100.0 | ||
Turnout | ||||
Democratic hold | ||||
2000
| Party | Candidate | Votes | % | |
|---|---|---|---|---|
Democratic | Henry Waxman (incumbent) | 180,295 | 75.7 | |
Republican | Jim Scileppi | 45,784 | 19.3 | |
Libertarian | Jack Anderson | 7,944 | 3.3 | |
Natural Law | Bruce Currivan | 4,178 | 1.7 | |
| Total votes | 238,201 | 100.0 | ||
Turnout | ||||
Democratic hold | ||||
2002
| Party | Candidate | Votes | % | |
|---|---|---|---|---|
Democratic | Adam Schiff (incumbent) | 76,036 | 62.6 | |
Republican | Jim Scileppi | 40,676 | 33.4 | |
Libertarian | Ted Brown | 4,889 | 4.0 | |
| Total votes | 121,541 | 100.0 | ||
Turnout | ||||
Democratic hold | ||||
2004
| Party | Candidate | Votes | % | |
|---|---|---|---|---|
Democratic | Adam Schiff (incumbent) | 133,670 | 64.7 | |
Republican | Harry Frank Scolinos | 62,871 | 30.4 | |
Green | Philip Koebel | 5,715 | 2.7 | |
Libertarian | Ted Brown | 4,570 | 2.2 | |
Independent | John Burton (write-in) | 6 | 0.0 | |
| Total votes | 206,832 | 100.0 | ||
Turnout | ||||
Democratic hold | ||||
2006
| Party | Candidate | Votes | % | |
|---|---|---|---|---|
Democratic | Adam Schiff (incumbent) | 91,014 | 63.5 | |
Republican | William J. Bodell | 39,321 | 27.5 | |
Green | William M. Paparian | 8,197 | 5.7 | |
Peace and Freedom | Lynda L. Llamas | 2,599 | 1.8 | |
Libertarian | Jim Keller | 2,258 | 1.5 | |
Independent | John Burton (write-in) | 15 | 0.0 | |
| Total votes | 143,404 | 100.0 | ||
Turnout | ||||
Democratic hold | ||||
2008
| Party | Candidate | Votes | % | |
|---|---|---|---|---|
Democratic | Adam Schiff (incumbent) | 146,198 | 68.9 | |
Republican | Charles Hahn | 56,727 | 26.7 | |
Libertarian | Alan Pyeatt | 9,219 | 4.4 | |
Turnout | ||||
Democratic hold | ||||
2010
| Party | Candidate | Votes | % | |
|---|---|---|---|---|
Democratic | Adam Schiff (incumbent) | 104,374 | 64.8 | |
Republican | John P. Colbert | 51,534 | 32.0 | |
Libertarian | William P. Cushing | 5,218 | 3.2 | |
Turnout | ||||
Democratic hold | ||||
2012
| Party | Candidate | Votes | % | |
|---|---|---|---|---|
Democratic | Tony Cardenas | 111,287 | 74.1 | |
No party preference | David R. Hernandez | 38,994 | 25.9 | |
| Total votes | 150,281 | 100.0 | ||
Democratic hold | ||||
2014
| Party | Candidate | Votes | % | |
|---|---|---|---|---|
Democratic | Tony Cardenas (incumbent) | 50,096 | 74.6 | |
Republican | William O'Callaghan Leader | 17,045 | 25.4 | |
| Total votes | 67,141 | 100.0 | ||
Democratic hold | ||||
2016
| Party | Candidate | Votes | % | |
|---|---|---|---|---|
Democratic | Tony Cardenas (incumbent) | 128,407 | 74.7 | |
Democratic | Richard Alarcon | 43,417 | 25.3 | |
| Total votes | 171,824 | 100.0 | ||
Democratic hold | ||||
2018
| Party | Candidate | Votes | % | |
|---|---|---|---|---|
Democratic | Tony Cardenas (incumbent) | 124,697 | 80.6 | |
Republican | Benito Benny Bernal | 29,995 | 19.4 | |
| Total votes | 154,692 | 100.0 | ||
Democratic hold | ||||
Living former representatives
As of March 2019[update], there are three former members of the U.S. House of Representatives from California's 29th congressional district that are currently living. The most recent representative to die was Augustus Hawkins (served 1975-1991) on November 10, 2007. He was also the most recently serving representative to die.
| Representative | Term in office | Date of birth (and age) |
|---|---|---|
Maxine Waters | 1991–1993 | (1938-08-15) August 15, 1938 |
Henry Waxman | 1993–2003 | (1939-09-12) September 12, 1939 |
Adam Schiff | 2003–2013 | (1960-06-22) June 22, 1960 |
Historical district boundaries

2003–2013

2013–present


See also
- List of United States congressional districts
References
^ US Census
^ LA Times
^ "Partisan Voting Index – Districts of the 115th Congress" (PDF). The Cook Political Report. April 7, 2017. Retrieved April 7, 2017..mw-parser-output cite.citation{font-style:inherit}.mw-parser-output .citation q{quotes:"""""""'""'"}.mw-parser-output .citation .cs1-lock-free a{background:url("//upload.wikimedia.org/wikipedia/commons/thumb/6/65/Lock-green.svg/9px-Lock-green.svg.png")no-repeat;background-position:right .1em center}.mw-parser-output .citation .cs1-lock-limited a,.mw-parser-output .citation .cs1-lock-registration a{background:url("//upload.wikimedia.org/wikipedia/commons/thumb/d/d6/Lock-gray-alt-2.svg/9px-Lock-gray-alt-2.svg.png")no-repeat;background-position:right .1em center}.mw-parser-output .citation .cs1-lock-subscription a{background:url("//upload.wikimedia.org/wikipedia/commons/thumb/a/aa/Lock-red-alt-2.svg/9px-Lock-red-alt-2.svg.png")no-repeat;background-position:right .1em center}.mw-parser-output .cs1-subscription,.mw-parser-output .cs1-registration{color:#555}.mw-parser-output .cs1-subscription span,.mw-parser-output .cs1-registration span{border-bottom:1px dotted;cursor:help}.mw-parser-output .cs1-ws-icon a{background:url("//upload.wikimedia.org/wikipedia/commons/thumb/4/4c/Wikisource-logo.svg/12px-Wikisource-logo.svg.png")no-repeat;background-position:right .1em center}.mw-parser-output code.cs1-code{color:inherit;background:inherit;border:inherit;padding:inherit}.mw-parser-output .cs1-hidden-error{display:none;font-size:100%}.mw-parser-output .cs1-visible-error{font-size:100%}.mw-parser-output .cs1-maint{display:none;color:#33aa33;margin-left:0.3em}.mw-parser-output .cs1-subscription,.mw-parser-output .cs1-registration,.mw-parser-output .cs1-format{font-size:95%}.mw-parser-output .cs1-kern-left,.mw-parser-output .cs1-kern-wl-left{padding-left:0.2em}.mw-parser-output .cs1-kern-right,.mw-parser-output .cs1-kern-wl-right{padding-right:0.2em}
^ Statement of Vote (1990 Governor)
^ Statement of Vote (1992 President)
^ Statement of Vote (1992 Senate)
^ Statement of Vote (1992 Senate)
^ Statement of Vote (1994 Governor)
^ Statement of Vote (1994 Senate)
^ Statement of Vote (1996 President)
^ Statement of Vote (1998 Governor) Archived September 29, 2011, at the Wayback Machine
^ Statement of Vote (1998 Senate) Archived September 29, 2011, at the Wayback Machine
^ Statement of Vote (2000 President)
^ Statement of Vote (2000 Senator)
^ Statement of Vote (2002 Governor)
^ Statement of Vote (2003 Recall Question)
^ Statement of Vote (2003 Governor)
^ Statement of Vote (2004 President)
^ Statement of Vote (2004 Senator)
^ Statement of Vote (2006 Governor)
^ Statement of Vote (2006 Senator)
^ Statement of Vote (2008 President)
^ Statement of Vote (2010 Governor)
^ Statement of Vote (2010 Senator)
^ Statement of Vote (2012 President)
^ Statement of Vote (2012 Senator)
^ Statement of Vote (2014 Governor)
^ Statement of Vote (2016 President)
^ Statement of Vote (2016 Senator)
^ Statement of Vote (2018 Governor)
^ Statement of Vote (2018 Senator)
^ 1952 election results
^ 1954 election results
^ 1956 election results
^ 1958 election results
^ 1960 election results
^ 1962 election results
^ 1964 election results
^ 1966 election results
^ 1968 election results
^ 1970 election results
^ 1972 election results
^ 1974 election results
^ 1976 election results
^ 1978 election results
^ 1980 election results
^ 1982 election results
^ 1984 election results
^ 1986 election results
^ 1988 election results
^ 1990 election results
^ 1992 election results
^ 1994 election results
^ 1996 election results
^ 1998 election results
^ 2000 election results
^ 2002 election results
^ 2004 election results
^ 2006 election results
^ 2008 election results
^ 2010 election results
^ 2012 election results
^ 2014 election results
^ 2016 election results
^ 2018 election results
External links
- GovTrack.us: California's 29th congressional district
- RAND California Election Returns: District Definitions
- California Voter Foundation map - CD29
Coordinates: 34°16′00″N 118°25′49″W / 34.26667°N 118.43028°W / 34.26667; -118.43028


