1925 Northern Ireland general election
| |||||||||||||||||||||||||||||||||||||||||||||||||||||||||||||||||||||||||||||||||||||||||
All 52 seats to the Northern Ireland House of Commons 27 seats were needed for a majority | |||||||||||||||||||||||||||||||||||||||||||||||||||||||||||||||||||||||||||||||||||||||||
|---|---|---|---|---|---|---|---|---|---|---|---|---|---|---|---|---|---|---|---|---|---|---|---|---|---|---|---|---|---|---|---|---|---|---|---|---|---|---|---|---|---|---|---|---|---|---|---|---|---|---|---|---|---|---|---|---|---|---|---|---|---|---|---|---|---|---|---|---|---|---|---|---|---|---|---|---|---|---|---|---|---|---|---|---|---|---|---|---|---|
| |||||||||||||||||||||||||||||||||||||||||||||||||||||||||||||||||||||||||||||||||||||||||
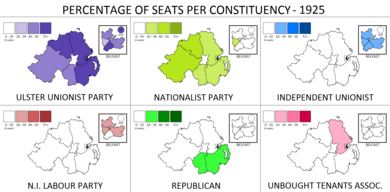 Percentage of seats gained by each of the party. | |||||||||||||||||||||||||||||||||||||||||||||||||||||||||||||||||||||||||||||||||||||||||
| |||||||||||||||||||||||||||||||||||||||||||||||||||||||||||||||||||||||||||||||||||||||||
Northern Ireland 1921–1972 |
|---|
This article is part of a series on the politics and government of Northern Ireland 1921–1972 |
Government
|
Parliament
|
Elections
|
See also
|
|
The 1925 Northern Ireland general election was held on 3 April 1925. It was the second election to the Parliament of Northern Ireland. It saw significant losses for the Ulster Unionist Party, although they maintained their large majority. This was the last election for the Stormont parliament conducted using the Proportional Representation system. It was abolished by the Ulster Unionist government during this parliament and replaced with the first-past-the-post system used in Great Britain.
Contents
1 Results
1.1 Votes summary
1.2 Seats summary
2 Notes
3 References
Results
32 | 10 | 4 | 3 | 2 | 1 |
UUP | Nationalist | IU | Lab | R |
| Northern Ireland General Election 1925 | |||||||||||||||
|---|---|---|---|---|---|---|---|---|---|---|---|---|---|---|---|
| Party | Candidates | Votes | |||||||||||||
| Stood | Elected | Gained | Unseated | Net | % of total | % | № | Net % | |||||||
| | UUP | 40 | 32 | 0 | 8 | -8 | 61.5 | 55.0 | 211,662 | -11.9 | |||||
| | Nationalist | 11 | 10 | 4 | 0 | +4 | 19.2 | 23.8 | 91,452 | +12.0 | |||||
| | Independent Unionist | 4 | 4 | 4 | 0 | +4 | 7.7 | 9.0 | 34,716 | N/A | |||||
| | Republican | 6 | 2 | 0 | 4 | -4 | 3.8 | 5.3 | 20,615 | -15.2 | |||||
| | NI Labour | 3 | 3 | 3 | 0 | +3 | 5.8 | 4.7 | 18,114 | +4.1 | |||||
| | Unbought Tenants | 1 | 1 | 1 | 0 | +1 | 1.9 | 1.3 | 4,886 | N/A | |||||
| | Town Tenants' Association | 1 | 0 | 0 | 0 | 0 | 0.9 | 3,320 | N/A | ||||||
Electorate 611,683 (512,264 in contested seats); Turnout: 75.1% (384,745).
Votes summary
Seats summary
Notes
^ As Belfast Labour Party.
References
- Northern Ireland Parliamentary Election Results


