Caernarfon (UK Parliament constituency)
Coordinates: 52°58′34″N 4°18′29″W / 52.976°N 4.308°W / 52.976; -4.308
| Caernarfon | |
|---|---|
Former County constituency for the House of Commons | |
 Boundary of Caernarfon in Wales for the 2005 general election. | |
| Preserved county | Gwynedd |
| Major settlements | Caernarfon |
1950–2010 | |
| Number of members | One |
| Replaced by | Arfon and Dwyfor Meirionnydd |
| 1536–1950 | |
| Number of members | One |
| Type of constituency | District of Boroughs constituency |
Caernarfon was a parliamentary constituency centred on the town of Caernarfon in Wales. It elected one Member of Parliament (MP) by the first past the post system.
The constituency was created in 1536 as a District of Boroughs, represented in the House of Commons of England until 1707, in the House of Commons of Great Britain from 1707 to 1800, and in the House of Commons of the United Kingdom from 1801 to 1950. The District of Boroughs was abolished in 1950, and replaced with a county constituency of the same name, which was itself abolished in 2010.
Contents
1 History
2 Boundaries
2.1 Caernarvon 1536–1832
2.2 Caernarvon Boroughs 1832–1950
2.3 Caernarvon 1950–1983
2.4 Caernarfon from 1983
3 Members of Parliament 1536–2010
4 Elections
4.1 Elections in the 1850s
4.2 Elections in the 1860s
4.3 Elections in the 1870s
4.4 Elections in the 1880s
4.5 Elections in the 1890s
4.6 Elections in the 1900s
4.7 Elections in the 1910s
4.8 Elections in the 1920s
4.9 Elections in the 1930s
4.10 Elections in the 1940s
4.11 Elections in the 1950s
4.12 Elections in the 1960s
4.13 Elections in the 1970s
4.14 Elections in the 1980s
4.15 Elections in the 1990s
4.16 Elections in the 2000s
5 See also
6 Notes and references
7 Sources
History
Known as Carnarvon until 1832, and then as the Carnarvon Boroughs or Carnarvon District of Boroughs from 1832 to 1950 and as Caernarvon from 1950 to 1983, it is named after Caernarfon, the main town within the constituency. Its most famous member was David Lloyd George, who was MP for 55 years. When Lloyd George became prime minister in 1916 it became the first Welsh constituency to be represented by a serving prime minister.
Plaid Cymru held the seat continuously from 1974 until its abolition in 2010, longer than they have held any other seat.
Boundaries
The constituency names, in this section, follow the format and the spelling used by F. W. S. Craig in his British Parliamentary Election Results series. Variations may be found in other sources.
Caernarvon 1536–1832
On the basis of information from several volumes of the History of Parliament, it is apparent that the history of the borough representation from Wales and Monmouthshire is more complicated than that of the English boroughs.
The Laws in Wales Act 1535 (26 Hen. VIII, c. 26) provided for a single borough seat for each of 11 of the 12 Welsh counties and Monmouthshire. The legislation, which was passed in 1536 (using the modern civil year starting on 1 January), was ambiguous as to which communities were enfranchised. The county towns were awarded a seat, but this in some fashion represented all the ancient boroughs of the county, as the others were required to contribute to the member's wages. It is not clear if the burgesses of the contributing boroughs could vote. The only election under the original scheme was for the 1542 Parliament. It seems that only burgesses from the county towns actually took part. An Act of 1544 (35 Hen. VIII, c. 11) confirmed that the contributing boroughs could send representatives to take part in the election at the county town. As far as can be told from surviving indentures of returns, the degree to which the out boroughs participated varied, but by the end of the 16th century all the seats had some participation from them at some elections at least.
The original scheme was modified by later legislation and decisions of the House of Commons, which were sometimes made with no regard to precedent or evidence: for example in 1728 it was decided that only the freemen of the borough of Montgomery could participate in the election for that seat, thus disenfranchising the freemen of Llanidloes, Welshpool and Llanfyllin.
In the case of Caernarvonshire (now Caernarfonshire), the county town was Caernarvon (now known as Caernarfon). The out boroughs were Conway (now Conwy), Criccieth (or Cricieth), Nevin (now known as Nefyn), and Pwllheli. The freemen of the five boroughs were entitled to vote. In the 1715–1754 period there were estimated to be about 1,600 freemen, of whom about 1,200 were non-resident. Later in the 18th century the estimated electorate was about 1,000 freemen.
Caernarvon Boroughs 1832–1950
The Caernarvon Boroughs was a district of boroughs constituency, which grouped a number of parliamentary boroughs in Caernarvonshire into one single member constituency. The voters in each participating borough cast ballots, which were added together over the whole district to decide the result of the poll. The enfranchised communities in this district, from 1832, were the six boroughs of Caernarvon, Bangor, Conway, Criccieth, Nevin, and Pwllheli.
The exact boundaries of the parliamentary boroughs in the district were altered by the Parliamentary Boundaries Act 1868, but the general nature of the constituency was unchanged. There were no further boundary changes in the 1885 redistribution of parliamentary seats.
In 1918 the constituency was redefined, to include the then local government areas of the Municipal Boroughs of Bangor, Caernarvon, Conway, and Pwllheli; the Urban Districts of Criccieth, Llandudno, Llanfairfechan and Penmaenmawr, as well as the Lleyn Rural District.
From 1918 to 1950 the administrative county of Caernarvonshire was divided into two seats: Caernarvon Boroughs and a Caernarvonshire county constituency. The territory of the borough seat was enclaved within the county constituency. Different local authorities, included in the borough constituency, were not necessarily adjoining.
Caernarvon 1950–1983
The redistribution, which took effect in 1950, created two Caernarvonshire county divisions – Caernarvon in the south-western two thirds of the county and Conway (later spelt Conwy) in the north-eastern third. The new divisions included territory which had come from both of the two old seats.
The local authorities, whose territories were combined to form the constituency in 1950, were the Municipal Boroughs of Caernarvon, and Pwllheli; the Urban Districts of Criccieth, and Portmadoc; as well as the Rural Districts of Gwyrfai and Lleyn. This arrangement was not altered by the redistribution which took effect in February 1974, which was based on the pre-1974 local government boundaries.
From 1 April 1974, a new pattern of counties was created in Wales. This constituency became part of the county of Gwynedd.
Caernarfon from 1983
In the redistribution of 1983, the spelling of the official name of the constituency was changed. The constituency boundary was unchanged, but it was redefined in terms of the local authorities created in 1974. It comprised the Borough of Arfon wards numbered 8 to 12 and 16 to 29, together with the District of Dwyfor.
In 1996 Welsh local government was again reorganised. Arfon and Dwyfor became part of a Gwynedd unitary authority.
The Parliamentary Constituencies (Wales) Order 1995, based on the pre-1996 local authority areas, came into effect in 1997. It defined this constituency as:-
(i) The following wards of the Borough of Arfon, namely, Bethel, Bontnewydd, Cadnant, Deiniolen, Llanberis, Llandwrog, Llanllyfni, Llanrug, Llanwnda, Menai (Caernarfon), Peb-lig, Penisarwaun, Penygroes, Seiont, Talysarn, Waunfawr and Y Felinheli; and
(ii) the District of Dwyfor.
Following radical boundary changes undertaken by the Boundary Commission for Wales, this seat was abolished in time for the general election in 2010, replaced by Arfon and part of Dwyfor Meirionnydd.
Members of Parliament 1536–2010
| Election | Member[1] | Party | |
|---|---|---|---|
| 1542 | John Puleston [2] | ||
| 1545 | Robert Gruffydd [2] | ||
| 1547 | Robert Puleston [2] | ||
| 1553 (Mar) | Gruffydd Davies [2] | ||
| 1553 (Oct) | Henry Robins [2] | ||
| 1554 (Apr) | Henry Robins [2] | ||
| 1554 (Nov) | Sir Rhys Gruffydd [2] | ||
| 1555 | Sir Rhys Gruffydd [3] | ||
| 1558 | Robert Gruffydd [2] | ||
| 1558/9 | Maurice Davies[4] | ||
| 1563 | John Harington [4] | ||
| 1571 | John Griffith [4] | ||
| 1572 | John Griffith [4] | ||
| 1584 | Edward Griffith [4] | ||
| 1586 | William Griffith I [4] | ||
| 1588 | Robert Wynn [4] | ||
| 1593 | Robert Griffith [4] | ||
| 1597 | John Owen [4] | ||
| 1601 | Nicholas Griffith [4] | ||
| 1604 | John Griffith, died replaced by Clement Edmondes | ||
| 1614 | Nicholas Griffith | ||
| 1621 | Nicholas Griffith | ||
| 1624 | Peter Mutton | ||
| 1625 | Edward Littleton, sat for Leominster replaced by Robert Jones | ||
| 1626 | Edward Littleton, sat for Leominster replaced by Robert Jones | ||
| 1628 | Edward Littleton | ||
| 1640 April | John Glynne | ||
| 1640 November | William Thomas, disabled 1644 | ||
| 1647 | William Foxwist | ||
Not represented in Parliaments of 1653, 1654 and 1656 | |||
| 1659 | Robert Williams | ||
| 1660 | William Glynne | ||
| 1661 | William Griffith | ||
| 1679 | Thomas Mostyn | ||
| 1685 | John Griffith | ||
| 1689 | Sir Robert Owen | ||
| 1698 | Sir John Wynn, Bt | ||
| 1705 | Thomas Bulkeley | ||
| 1708 | William Griffith | ||
| 1713 | Sir Thomas Wynn, Bt | ||
1749 | Sir William Wynn | ||
1754 | Robert Wynne | ||
1761 | Sir John Wynn, Bt | ||
1768 | Glyn Wynn | ||
1790 | Lord Paget | ||
1796 | Hon. Edward Paget | ||
1806 | Hon. Sir Charles Paget | ||
1826 | Lord William Paget | Whig | |
1830 | William Ormsby-Gore | Tory | |
1831 | Hon. Sir Charles Paget | Whig | |
| 1833 | Owen Jones Ellis Nanney | Tory | |
| 1833 | Hon. Sir Charles Paget | Whig | |
1835 | Sir Love Jones-Parry | Whig | |
1837 | William Bulkeley Hughes | Conservative | |
| 1846 | Peelite[5] | ||
1859 | Charles Wynne | Conservative | |
1865 | William Bulkeley Hughes | Liberal | |
1882 | Love Jones-Parry | Liberal | |
1886 | Edmund Swetenham | Conservative | |
1890 | David Lloyd George | Liberal | |
| 1916 | Coalition Liberal | ||
1922 | National Liberal | ||
1923 | Liberal | ||
1945 By-election | Seaborne Davies | Liberal | |
1945 | David Price-White | Conservative | |
1950 | Goronwy Roberts | Labour | |
Feb 1974 | Dafydd Wigley | Plaid Cymru | |
2001 | Hywel Williams | Plaid Cymru | |
2010 | Constituency abolished: see Arfon (UK Parliament constituency) | ||
Elections
Elections in the 1850s
| Party | Candidate | Votes | % | ± | |
|---|---|---|---|---|---|
Peelite | William Bulkeley Hughes | 369 | 57.2 | N/A | |
Radical | Richard Davies[7][8] | 276 | 42.8 | N/A | |
| Majority | 93 | 14.4 | N/A | ||
Turnout | 645 | 74.9 | N/A | ||
Registered electors | 861 | ||||
Peelite hold | Swing | N/A | |||
| Party | Candidate | Votes | % | ± | |
|---|---|---|---|---|---|
Peelite | William Bulkeley Hughes | Unopposed | |||
Registered electors | 919 | ||||
Peelite hold | |||||
| Party | Candidate | Votes | % | ± | |
|---|---|---|---|---|---|
Conservative | Charles Wynne | 380 | 53.7 | N/A | |
Liberal | William Bulkeley Hughes | 328 | 46.3 | N/A | |
| Majority | 52 | 7.3 | N/A | ||
Turnout | 708 | 76.2 | N/A | ||
Registered electors | 929 | ||||
Conservative gain from Liberal | Swing | N/A | |||
Elections in the 1860s
| Party | Candidate | Votes | % | ± | |
|---|---|---|---|---|---|
Liberal | William Bulkeley Hughes | Unopposed | |||
Registered electors | 1,070 | ||||
Liberal gain from Conservative | |||||
| Party | Candidate | Votes | % | ± | |
|---|---|---|---|---|---|
Liberal | William Bulkeley Hughes | 1,601 | 60.4 | N/A | |
Conservative | Thomas Wynn | 1,051 | 39.6 | N/A | |
| Majority | 550 | 20.7 | N/A | ||
Turnout | 2,652 | 78.6 | N/A | ||
Registered electors | 3,376 | ||||
Liberal hold | |||||
Elections in the 1870s
| Party | Candidate | Votes | % | ± | |
|---|---|---|---|---|---|
Liberal | William Bulkeley Hughes | Unopposed | |||
Registered electors | 3,833 | ||||
Liberal hold | |||||
Elections in the 1880s
| Party | Candidate | Votes | % | ± | |
|---|---|---|---|---|---|
Liberal | William Bulkeley Hughes | Unopposed | |||
Registered electors | 4,157 | ||||
Liberal hold | |||||
Hughes' death caused a by-election.
| Party | Candidate | Votes | % | ± | |
|---|---|---|---|---|---|
Liberal | Love Jones-Parry | 2,037 | 77.4 | N/A | |
Independent Liberal | Robert Sorton-Parry[9] | 596 | 22.6 | N/A | |
| Majority | 1,441 | 54.7 | N/A | ||
Turnout | 2,633 | 62.3 | N/A | ||
Registered electors | 4,223 | ||||
Liberal hold | Swing | N/A | |||
| Party | Candidate | Votes | % | ± | |
|---|---|---|---|---|---|
Liberal | Love Jones-Parry | 1,923 | 50.9 | N/A | |
Conservative | Edmund Swetenham | 1,858 | 49.1 | N/A | |
| Majority | 65 | 1.8 | N/A | ||
Turnout | 3,781 | 84.5 | N/A | ||
Registered electors | 4,476 | ||||
Liberal hold | Swing | N/A | |||
| Party | Candidate | Votes | % | ± | |
|---|---|---|---|---|---|
Conservative | Edmund Swetenham | 1,820 | 51.9 | +2.8 | |
Liberal | Love Jones-Parry | 1,684 | 48.1 | -2.8 | |
| Majority | 136 | 3.8 | N/A | ||
Turnout | 3,504 | 78.3 | -6.2 | ||
Registered electors | 4,476 | ||||
Conservative gain from Liberal | Swing | +2.8 | |||
Elections in the 1890s
| Party | Candidate | Votes | % | ± | |
|---|---|---|---|---|---|
Liberal | David Lloyd George | 1,963 | 50.2 | +2.1 | |
Conservative | Hugh Ellis-Nanney | 1,945 | 49.8 | -2.1 | |
| Majority | 18 | 0.4 | N/A | ||
Turnout | 3,908 | 89.5 | +11.2 | ||
Registered electors | 4,366 | ||||
Liberal gain from Conservative | Swing | +2.1 | |||
| Party | Candidate | Votes | % | ± | |
|---|---|---|---|---|---|
Liberal | David Lloyd George | 2,154 | 52.4 | +4.3 | |
Conservative | John Henry Puleston | 1,958 | 47.6 | −4.3 | |
| Majority | 196 | 4.8 | N/A | ||
Turnout | 4,112 | 87.1 | +8.8 | ||
Registered electors | 4,723 | ||||
Liberal gain from Conservative | Swing | +4.3 | |||

David Lloyd George
| Party | Candidate | Votes | % | ± | |
|---|---|---|---|---|---|
Liberal | David Lloyd George | 2,265 | 52.2 | -0.2 | |
Conservative | Hugh Ellis-Nanney | 2,071 | 47.8 | +0.2 | |
| Majority | 194 | 4.4 | -0.4 | ||
Turnout | 4,336 | 88.8 | +1.7 | ||
Registered electors | 4,881 | ||||
Liberal hold | Swing | −0.2 | |||
Elections in the 1900s
| Party | Candidate | Votes | % | ± | |
|---|---|---|---|---|---|
Liberal | David Lloyd George | 2,412 | 53.3 | +1.1 | |
Conservative | Henry Platt | 2,116 | 46.7 | -1.1 | |
| Majority | 296 | 6.6 | +2.2 | ||
Turnout | 4,528 | 87.0 | -1.8 | ||
Registered electors | 5,202 | ||||
Liberal hold | Swing | +1.1 | |||
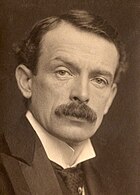
David Lloyd George
| Party | Candidate | Votes | % | ± | |
|---|---|---|---|---|---|
Liberal | David Lloyd George | 3,221 | 61.7 | +8.4 | |
Conservative | R A Naylor | 1,997 | 38.3 | -8.4 | |
| Majority | 1,224 | 23.4 | +16.8 | ||
Turnout | 5,218 | 92.1 | +5.1 | ||
Registered electors | 5,668 | ||||
Liberal hold | Swing | +8.4 | |||
Elections in the 1910s
| Party | Candidate | Votes | % | ± | |
|---|---|---|---|---|---|
Liberal | David Lloyd George | 3,183 | 60.2 | -1.5 | |
Conservative | Hugh Corbet Vincent | 2,105 | 39.8 | +1.5 | |
| Majority | 1,078 | 20.4 | -3.0 | ||
Turnout | 5,288 | 92.5 | +0.4 | ||
Liberal hold | Swing | ||||
| Party | Candidate | Votes | % | ± | |
|---|---|---|---|---|---|
Liberal | David Lloyd George | 3,112 | 62.0 | +1.8 | |
Conservative | A L Jones | 1,904 | 38.0 | -1.8 | |
| Majority | 1,208 | 24.0 | +3.6 | ||
Turnout | 5,288 | 87.7 | -4.8 | ||
Liberal hold | Swing | ||||

Lloyd George
| Party | Candidate | Votes | % | ± | |
|---|---|---|---|---|---|
C | Liberal | David Lloyd George | 13,993 | 92.7 | +30.7 |
Independent | Austin Harrison | 1,095 | 7.3 | ||
| Majority | 12,898 | 85.4 | +61.4 | ||
Turnout | 15,088 | 63.4 | -24.3 | ||
Liberal hold | Swing | ||||
C indicates candidate endorsed by the coalition government. | |||||

Lloyd George
Elections in the 1920s
| Party | Candidate | Votes | % | ± | |
|---|---|---|---|---|---|
National Liberal | David Lloyd George | Unopposed | N/A | N/A | |
National Liberal hold | Swing | N/A | |||
| Party | Candidate | Votes | % | ± | |
|---|---|---|---|---|---|
Liberal | David Lloyd George | 12,499 | 63.1 | n/a | |
Unionist | Austin Ellis Lloyd Jones | 7,323 | 36.9 | n/a | |
| Majority | 5,176 | 26.2 | n/a | ||
Turnout | 19,822 | 80.9 | n/a | ||
Liberal hold | Swing | n/a | |||
| Party | Candidate | Votes | % | ± | |
|---|---|---|---|---|---|
Liberal | David Lloyd George | 16,058 | 82.5 | +19.4 | |
Labour | Alfred Zimmern | 3,401 | 17.5 | ||
| Majority | 12,657 | 65.0 | +38.8 | ||
Turnout | 19,459 | 77.0 | -3.9 | ||
Liberal hold | Swing | ||||
| Party | Candidate | Votes | % | ± | |
|---|---|---|---|---|---|
Liberal | David Lloyd George | 16,647 | 58.0 | -24.4 | |
Unionist | John Bowen Davies | 7,514 | 26.2 | n/a | |
Labour | Thomas Ap Rhys | 4,536 | 15.8 | -1.7 | |
| Majority | 9,133 | 31.8 | -33.2 | ||
Turnout | 28,697 | 81.8 | +4.8 | ||
Liberal hold | Swing | ||||
Elections in the 1930s
| Party | Candidate | Votes | % | ± | |
|---|---|---|---|---|---|
Liberal | David Lloyd George | 17,101 | 59.3 | +1.3 | |
Conservative | F P Gourlay | 11,714 | 40.7 | +14.5 | |
| Majority | 5,387 | 18.6 | -13.2 | ||
Turnout | 28,815 | 80.3 | -1.5 | ||
Liberal hold | Swing | ||||
| Party | Candidate | Votes | % | ± | |
|---|---|---|---|---|---|
Liberal | David Lloyd George | 19,242 | 66.6 | +7.3 | |
Conservative | A R P Du Cros | 9,633 | 33.4 | -7.3 | |
| Majority | 9,609 | 33.2 | +14.6 | ||
Turnout | 28,873 | 77.4 | -2.9 | ||
Liberal hold | Swing | ||||
Elections in the 1940s
| Party | Candidate | Votes | % | ± | |
|---|---|---|---|---|---|
Liberal | Seaborne Davies | 20,754 | 75.2 | +8.6 | |
Plaid Cymru | John Edward Daniel | 6,844 | 24.8 | ||
| Majority | 13,910 | 50.4 | +17.2 | ||
Turnout | 27,598 | 58.8 | -18.6 | ||
Liberal hold | Swing | ||||
| Party | Candidate | Votes | % | ± | |
|---|---|---|---|---|---|
Conservative | David Price-White | 11,432 | 32.9 | -0.5 | |
Liberal | Seaborne Davies | 11,096 | 32.0 | -34.6 | |
Labour | William Elwyn Edwards Jones | 10,625 | 30.6 | N/A | |
Plaid Cymru | John Edward Daniel | 1,560 | 4.5 | N/A | |
| Majority | 336 | 0.9 | |||
Turnout | 34,713 | 73.8 | +15.0 | ||
Conservative gain from Liberal | Swing | ||||
Elections in the 1950s
| Party | Candidate | Votes | % | ± | |
|---|---|---|---|---|---|
Labour | Goronwy Roberts | 18,369 | 49.1 | ||
Liberal | Elwyn Rhys Thomas | 7,791 | 20.9 | ||
Conservative | G. W. Williams | 6,315 | 16.9 | ||
Plaid Cymru | John Jones | 4,882 | 13.1 | ||
| Majority | 10,578 | 28.2 | |||
Turnout | 85.9 | ||||
Labour hold | Swing | ||||
| Party | Candidate | Votes | % | ± | |
|---|---|---|---|---|---|
Labour | Goronwy Roberts | 22,375 | 62.4 | ||
Conservative | John E B Davies | 13,479 | 37.6 | ||
| Majority | 8,896 | 24.8 | |||
Turnout | 82.5 | ||||
Labour hold | Swing | ||||
| Party | Candidate | Votes | % | ± | |
|---|---|---|---|---|---|
Labour | Goronwy Roberts | 17,682 | 50.2 | ||
Conservative | O Meurig Roberts | 8,461 | 24.0 | ||
Plaid Cymru | Robert E Jones | 5,815 | 16.5 | ||
Liberal | D Geraint Williams | 3,277 | 9.3 | ||
| Majority | 9,221 | 26.3 | |||
Turnout | 35,235 | 82.4 | |||
Labour hold | Swing | ||||
| Party | Candidate | Votes | % | ± | |
|---|---|---|---|---|---|
Labour | Goronwy Roberts | 17,506 | 51.0 | ||
Conservative | Tom Hooson | 9,564 | 27.8 | ||
Plaid Cymru | Dafydd Orwig Jones | 7,293 | 21.2 | ||
| Majority | 7,942 | 23.1 | |||
Turnout | 34,363 | 83.4 | |||
Labour hold | Swing | ||||
Elections in the 1960s
| Party | Candidate | Votes | % | ± | |
|---|---|---|---|---|---|
Labour | Goronwy Roberts | 17,777 | 54.38 | +3.38 | |
Conservative | Shelagh Roberts | 7,915 | 24.21 | -3.59 | |
Plaid Cymru | Robert E Jones | 6,998 | 21.41 | +0.21 | |
| Majority | 9,862 | 30.17 | +7.07 | ||
Turnout | 32,690 | 80.38 | -3.02 | ||
Registered electors | 40,671 | ||||
Labour hold | Swing | +3.49 | |||
| Party | Candidate | Votes | % | ± | |
|---|---|---|---|---|---|
Labour | Goronwy Roberts | 17,650 | 56.11 | +1.73 | |
Conservative | Roger Prys | 6,972 | 22.16 | -2.05 | |
Plaid Cymru | Humphrey Roberts | 6,834 | 21.73 | +0.32 | |
| Majority | 10,678 | 33.95 | +3.78 | ||
Turnout | 31,456 | 78.40 | -1.92 | ||
Registered electors | 40,121 | ||||
Labour hold | Swing | +1.89 | |||
Elections in the 1970s
| Party | Candidate | Votes | % | ± | |
|---|---|---|---|---|---|
Labour | Goronwy Roberts | 13,627 | 40.1 | ||
Plaid Cymru | Robyn Léwis | 11,331 | 33.4 | ||
Conservative | Kathleen J Smith | 6,812 | 20.1 | ||
Liberal | John A Williams | 2,195 | 6.5 | ||
| Majority | 2,296 | 6.76 | |||
Turnout | 81.7 | ||||
Labour hold | Swing | ||||
| Party | Candidate | Votes | % | ± | |
|---|---|---|---|---|---|
Plaid Cymru | Dafydd Wigley | 14,103 | 40.5 | +7.1 | |
Labour | Goronwy Roberts | 12,375 | 35.6 | −4.5 | |
Conservative | Tristan Garel-Jones | 5,803 | 16.7 | −3.4 | |
Liberal | Gerald Hill David | 2,506 | 7.2 | +0.7 | |
| Majority | 1,728 | 5.0 | |||
Turnout | 34,787 | 82.4 | |||
Plaid Cymru gain from Labour | Swing | ||||
| Party | Candidate | Votes | % | ± | |
|---|---|---|---|---|---|
Plaid Cymru | Dafydd Wigley | 14,624 | 42.6 | +2.0 | |
Labour | Emlyn Jones Sherrington | 11,730 | 34.1 | −1.4 | |
Conservative | Robert Lambart Harvey | 4,325 | 12.6 | −4.1 | |
Liberal | Dewi Williams | 3,690 | 10.7 | +3.5 | |
| Majority | 2,894 | 8.4 | |||
Turnout | 34,369 | 80.9 | |||
Plaid Cymru hold | Swing | +1.7 | |||
| Party | Candidate | Votes | % | ± | |
|---|---|---|---|---|---|
Plaid Cymru | Dafydd Wigley | 17,420 | 49.7 | +7.1 | |
Labour | Thomas Merfyn Hughes | 8,696 | 24.8 | −9.3 | |
Conservative | James Edward Thornton Paice | 6,968 | 19.9 | +7.3 | |
Liberal | John Trevor Edwards | 1,999 | 5.7 | −5.0 | |
| Majority | 8,724 | 24.9 | |||
Turnout | 35,083 | 81.5 | |||
Plaid Cymru hold | Swing | +8.2 | |||
Elections in the 1980s
| Party | Candidate | Votes | % | ± | |
|---|---|---|---|---|---|
Plaid Cymru | Dafydd Wigley | 18,308 | 52.7 | +3.1 | |
Conservative | Dennis Jones | 7,319 | 21.1 | +1.2 | |
Labour | Betty Williams | 6,736 | 19.4 | −5.4 | |
Liberal | Owain Griffiths | 2,356 | 6.8 | +1.1 | |
| Majority | 10,989 | 31.6 | |||
Turnout | 34,719 | 78.6 | |||
Plaid Cymru hold | Swing | ||||
| Party | Candidate | Votes | % | ± | |
|---|---|---|---|---|---|
Plaid Cymru | Dafydd Wigley | 20,338 | 57.1 | +4.4 | |
Conservative | Felix Aubel | 7,526 | 21.1 | +0.1 | |
Labour | David Williams | 5,652 | 15.9 | −3.5 | |
Liberal | John Parsons | 2,103 | 5.9 | −0.9 | |
| Majority | 12,812 | 36.0 | |||
Turnout | 35,619 | 78.0 | |||
Plaid Cymru hold | Swing | ||||
Elections in the 1990s
| Party | Candidate | Votes | % | ± | |
|---|---|---|---|---|---|
Plaid Cymru | Dafydd Wigley | 21,439 | 59.0 | +1.9 | |
Conservative | Peter E.H. Fowler | 6,963 | 19.2 | −2.0 | |
Labour | Sharon Mainwaring | 5,641 | 15.5 | −0.3 | |
Liberal Democrat | Robert W. Williams | 2,101 | 5.8 | −0.1 | |
Natural Law | Gwyndaf Evans | 173 | 0.5 | N/A | |
| Majority | 14,476 | 39.9 | +3.9 | ||
Turnout | 36,317 | 80.1 | +2.1 | ||
Plaid Cymru hold | Swing | +1.9 | |||
| Party | Candidate | Votes | % | ± | |
|---|---|---|---|---|---|
Plaid Cymru | Dafydd Wigley | 17,616 | 51.0 | −8.0 | |
Labour | Eifion Wyn Williams | 10,167 | 29.5 | +14.0 | |
Conservative | Elwyn Williams | 4,230 | 12.3 | −6.9 | |
Liberal Democrat | Mary Macqueen | 1,686 | 4.9 | −0.9 | |
Referendum | Clive Collins | 811 | 2.4 | N/A | |
| Majority | 7,449 | 21.6 | -18.3 | ||
Turnout | 34,510 | 73.7 | −6.4 | ||
Plaid Cymru hold | Swing | −11.0 | |||
Elections in the 2000s
| Party | Candidate | Votes | % | ± | |
|---|---|---|---|---|---|
Plaid Cymru | Hywel Williams | 12,894 | 44.4 | −6.7 | |
Labour | Martin Eaglestone | 9,383 | 32.3 | +2.8 | |
Conservative | Bronwen Naish | 4,403 | 15.2 | +2.9 | |
Liberal Democrat | Evan Ab-Owain | 1,823 | 6.3 | +1.4 | |
UKIP | Ifor Lloyd | 550 | 1.9 | N/A | |
| Majority | 3,511 | 12.1 | -9.5 | ||
Turnout | 29,053 | 62.0 | −11.7 | ||
Plaid Cymru hold | Swing | −4.7 | |||
| Party | Candidate | Votes | % | ± | |
|---|---|---|---|---|---|
Plaid Cymru | Hywel Williams | 12,747 | 45.5 | +1.1 | |
Labour | Martin Eaglestone | 7,538 | 26.9 | −5.4 | |
Liberal Democrat | Evan Ab-Owain | 3,508 | 12.5 | +6.2 | |
Conservative | Guy Opperman | 3,483 | 12.4 | −2.8 | |
UKIP | Elwyn Williams | 723 | 2.6 | +0.7 | |
| Majority | 5,209 | 18.6 | +6.5 | ||
Turnout | 27,999 | 60.4 | −1.6 | ||
Plaid Cymru hold | Swing | +3.3 | |||
See also
- Caernarvon Boroughs by-election, 1890
- Caernarvon Boroughs by-election, 1945
- List of Parliamentary constituencies in Gwynedd
Notes and references
^ Leigh Rayment's Historical List of MPs – Constituencies beginning with "C" (part 1)
^ abcdefgh "History of Parliament". History of Parliament Trust. Retrieved 2011-11-27..mw-parser-output cite.citation{font-style:inherit}.mw-parser-output q{quotes:"""""""'""'"}.mw-parser-output code.cs1-code{color:inherit;background:inherit;border:inherit;padding:inherit}.mw-parser-output .cs1-lock-free a{background:url("//upload.wikimedia.org/wikipedia/commons/thumb/6/65/Lock-green.svg/9px-Lock-green.svg.png")no-repeat;background-position:right .1em center}.mw-parser-output .cs1-lock-limited a,.mw-parser-output .cs1-lock-registration a{background:url("//upload.wikimedia.org/wikipedia/commons/thumb/d/d6/Lock-gray-alt-2.svg/9px-Lock-gray-alt-2.svg.png")no-repeat;background-position:right .1em center}.mw-parser-output .cs1-lock-subscription a{background:url("//upload.wikimedia.org/wikipedia/commons/thumb/a/aa/Lock-red-alt-2.svg/9px-Lock-red-alt-2.svg.png")no-repeat;background-position:right .1em center}.mw-parser-output .cs1-subscription,.mw-parser-output .cs1-registration{color:#555}.mw-parser-output .cs1-subscription span,.mw-parser-output .cs1-registration span{border-bottom:1px dotted;cursor:help}.mw-parser-output .cs1-hidden-error{display:none;font-size:100%}.mw-parser-output .cs1-visible-error{font-size:100%}.mw-parser-output .cs1-subscription,.mw-parser-output .cs1-registration,.mw-parser-output .cs1-format{font-size:95%}.mw-parser-output .cs1-kern-left,.mw-parser-output .cs1-kern-wl-left{padding-left:0.2em}.mw-parser-output .cs1-kern-right,.mw-parser-output .cs1-kern-wl-right{padding-right:0.2em}
^ GRUFFYDD, Sir Rhys (by 1513-80), of Penrhyn, Caern. History of Parliament. Retrieved 6 June 2018.
^ abcdefghij "History of Parliament". History of Parliament Trust. Retrieved 2011-11-27.
^ Cragoe, Matthew (2004). Culture, Politics, and National Identity in Wales, 1832-1886. Oxford: Oxford University Press. p. 61. ISBN 0-19-820754-9. Retrieved 19 August 2018 – via Google Books.
^ abcdefgh Craig, F. W. S., ed. (1977). British Parliamentary Election Results 1832-1885 (e-book)|format=requires|url=(help) (1st ed.). London: Macmillan Press. ISBN 978-1-349-02349-3.
^ "The General Elections". Globe. 9 July 1852. p. 4. Retrieved 21 August 2018 – via British Newspaper Archive. (Subscription required (help)).
^ "The Carnarvon Boroughs Election". North Wales Chronicle. 9 July 1852. pp. 4–5. Retrieved 21 August 2018 – via British Newspaper Archive. (Subscription required (help)).
^ "Tuesday". Eddowes's Journal, and General Advertiser for Shropshire, and the Principality of Wales. 19 Apr 1882. p. 3. Retrieved 24 November 2017.
^ abcdefghi Craig, FWS, ed. (1974). British Parliamentary Election Results: 1885-1918. London: Macmillan Press. ISBN 9781349022984.
^ Etholiadau'r ganrif 1885-1997, Beti Jones
^ Kimber, Richard. "UK General Election results 1964". Political Science Resources. Retrieved 14 April 2016.
^ [1]
^ Kimber, Richard. "UK General Election results 1966". Political Science Resources. Retrieved 14 April 2016.
^ [2]
^ "UK General Election results 1970". Politics Resources. Retrieved 20 March 2016.
^ abc "'Caernarvon', Feb 1974 - May 1983". ElectionWeb Project. Cognitive Computing Limited. Retrieved 4 March 2016.
^ "UK General Election results February 1974". Politics Resources. Retrieved 20 March 2016.
^ "UK General Election results October 1974". Politics Resources. Retrieved 20 March 2016.
^ "UK General Election results May 1979". Politics Resources. Retrieved 20 March 2016.
^ "Election Data 1983". Electoral Calculus. Archived from the original on 15 October 2011. Retrieved 18 October 2015.
^ ab "'Caernarfon', June 1983 up to May 1997". ElectionWeb Project. Cognitive Computing Limited. Retrieved 4 March 2016.
^ "Election Data 1987". Electoral Calculus. Archived from the original on 15 October 2011. Retrieved 18 October 2015.
^ "Election Data 1992". Electoral Calculus. Archived from the original on 15 October 2011. Retrieved 18 October 2015.
^ "Politics Resources". Election 1992. Politics Resources. 9 April 1992. Retrieved 6 Dec 2010.
^ "Election Data 1997". Electoral Calculus. Archived from the original on 15 October 2011. Retrieved 18 October 2015.
^ "Election Data 2001". Electoral Calculus. Archived from the original on 15 October 2011. Retrieved 18 October 2015.
^ "Election Data 2005". Electoral Calculus. Archived from the original on 15 October 2011. Retrieved 18 October 2015.
Sources
Boundaries of Parliamentary Constituencies 1885–1972, compiled and edited by F. W. S. Craig (Parliamentary Reference Publications 1972)
British Parliamentary Constituencies: A Statistical Compendium, by Ivor Crewe and Anthony Fox (Faber and Faber 1984)
British Parliamentary Election Results 1832–1885, compiled and edited by F.W.S. Craig (The Macmillan Press 1977)
F. W. S. Craig, British Parliamentary Election Results 1885 – 1918
F. W. S. Craig, British Parliamentary Election Results 1918 – 1949
British Parliamentary Election Results 1950–1973, compiled and edited by F.W.S. Craig (Parliamentary Research Services 1983)
The House of Commons 1509–1558, by S.T. Bindoff (Secker & Warburg 1982)
The House of Commons 1558–1603, by P.W. Hasler (HMSO 1981)
The House of Commons 1715–1754, by Romney Sedgwick (HMSO 1970)
The House of Commons 1754–1790, by Sir Lewis Namier and John Brooke (HMSO 1964)
The Parliaments of England by Henry Stooks Smith (1st edition published in three volumes 1844–50), second edition edited (in one volume) by F.W.S. Craig (Political Reference Publications 1973)
Parliament of the United Kingdom | ||
|---|---|---|
| Preceded by Fife East | Constituency represented by the Chancellor of the Exchequer 1908–1915 | Succeeded by Monmouthshire North |
| Preceded by Fife East | Constituency represented by the Prime Minister 1916–1922 | Succeeded by Glasgow Central |
| Preceded by Liverpool Scotland | Constituency represented by the Father of the House 1929–1945 | Succeeded by Horsham |


