Regina—Qu'Appelle
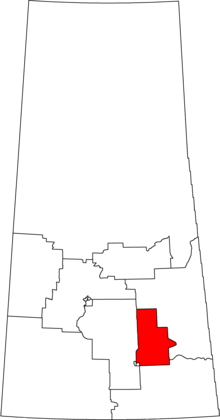 Regina–Qu'Appelle in relation to other Saskatchewan federal electoral districts as of the 2013 Representation Order. | |||
| Federal electoral district | |||
| Legislature | House of Commons | ||
| MP |
Andrew Scheer Conservative | ||
| District created | 1996 | ||
| First contested | 1997 | ||
| Last contested | 2015 | ||
| District webpage | profile, map | ||
| Demographics | |||
| Population (2011)[1] | 72,891 | ||
Electors (2015) | 52,220 | ||
| Area (km²)[2] | 13,430 | ||
| Pop. density (per km²) | 5.4 | ||
| Census subdivisions | Regina, Fort Qu'Appelle, Balgonie, Indian Head, Pilot Butte, White City, Wynyard, Edenwold No. 158, Qu'Appelle, Muskowekwan 85, Kawacatoose 88, Day Star 87, Gordon 86, Southey, North Qu'Appelle No. 187, Cupar, Big Quill No. 308, Piapot 75, Muscowpetung 80, Pasqua 79, Standing Buffalo 78, Punnichy, Cupar No. 218, Raymore, Mount Hope No. 279 | ||
Regina—Qu'Appelle (formerly Qu'Appelle) is a federal electoral district in Saskatchewan, Canada, that has been represented in the House of Commons of Canada from 1904 to 1968 and since 1988.
Contents
1 Geography
2 Demographics
3 History
4 Members of Parliament
4.1 Current member of Parliament
5 Election results
5.1 Regina—Qu'Appelle
5.2 Qu'Appelle, 1988–2000
5.3 Qu'Appelle, 1904–1968
6 See also
7 References
7.1 Notes
8 External links
Geography
The district includes the northeastern quarter of the city of Regina and the surrounding eastern rural area including the towns of Balgonie, Fort Qu'Appelle, Indian Head, Qu'Appelle, Pilot Butte, and White City; extending northwards to the towns of Southey, Cupar, Raymore, Punnichy, and Wynyard.
Demographics
- According to the Canada 2011 Census; 2013 representation[3][4]
Ethnic groups: 72.5% White, 21.7% Aboriginal, 1.2% South Asian, 1.0% Black, 1.0% Filipino
Languages: 91.0% English, 1.3% Ukrainian, 1.2% German, 1.0% French
Religions: 67.2% Christian (28.8% Catholic, 11.9% United Church, 7.9% Lutheran, 4.0% Anglican, 1.3% Baptist, 1.3% Pentecostal, 12.0% Other), 3.6% Traditional Aboriginal Spirituality, 1.1% Muslim, 26.9% No religion
Median income (2010): $29,627
Average income (2010): $37,401
History
The Qu'Appelle riding was first created in 1903 and covered the Northwest Territories, including what would later be Saskatchewan. In 1905, the district was amended to just cover Saskatchewan.[5]
In 1966, Qu'Appelle riding was abolished when it was redistributed between the Qu'Appelle—Moose Mountain, Regina—Lake Centre, Regina East and Assiniboia ridings.[6]
In 1987, Regina—Qu'Appelle was created from parts of the Assiniboia, Humboldt—Lake Centre, Qu'Appelle–Moose Mountain and Regina East ridings.[7]
The riding was known as Qu'Appelle from 1996 to 1998.[8] In 1998, its name was changed back to Regina—Qu'Appelle.[9]
This riding gained fractions of territory from Palliser, Regina—Lumsden—Lake Centre and Blackstrap during the 2012 electoral redistribution. It became the only hybrid urban-rural riding in the Regina area after the 2012 redistribution.
Members of Parliament
The riding has elected the following members of the House of Commons:
| Parliament | Years | Member | Party | |
|---|---|---|---|---|
| Qu'Appelle | ||||
| 10th | 1904–1908 | Richard Stuart Lake | Conservative | |
| 11th | 1908–1911 | |||
| 12th | 1911–1917 | Levi Thomson | Liberal | |
| 13th | 1917–1921 | Government (Unionist) | ||
| 14th | 1921–1925 | John Millar | Progressive | |
| 15th | 1925–1926 | |||
| 16th | 1926–1930 | Liberal–Progressive | ||
| 17th | 1930–1935 | Ernest Perley | Liberal | |
| 18th | 1935–1940 | Conservative | ||
| 19th | 1940–1945 | National Government | ||
| 20th | 1945–1949 | Gladys Strum | Co-operative Commonwealth | |
| 21st | 1949–1953 | Austin Edwin Dewar | Liberal | |
| 22nd | 1953–1957 | Henry Mang | ||
| 23rd | 1957–1958 | Alvin Hamilton | Progressive Conservative | |
| 24th | 1958–1962 | |||
| 25th | 1962–1963 | |||
| 26th | 1963–1965 | |||
| 27th | 1965–1968 | |||
| Riding dissolved into Qu'Appelle—Moose Mountain, Regina—Lake Centre, Regina East and Assiniboia | ||||
Regina—Qu'Appelle Riding created from Assiniboia, Humboldt—Lake Centre, Qu'Appelle—Moose Mountain and Regina East | ||||
| 34th | 1988–1993 | Simon De Jong | New Democratic | |
| 35th | 1993–1997 | |||
| Qu'Appelle | ||||
| 36th | 1997–2000 | Lorne Nystrom | New Democratic | |
| Regina—Qu'Appelle | ||||
| 37th | 2000–2004 | Lorne Nystrom | New Democratic | |
| 38th | 2004–2006 | Andrew Scheer | Conservative | |
| 39th | 2006–2008 | |||
| 40th | 2008–2011 | |||
| 41st | 2011–2015 | |||
| 42nd | 2015–Present | |||
Current member of Parliament
Its Member of Parliament is Andrew Scheer, the current leader of the Conservative Party of Canada and Leader of the Official Opposition. A former insurance broker, he served in the 41st Canadian Parliament as Speaker of the House of Commons. He was first elected in the 2004 election. In the last parliamentary session he served as a member on the 'Standing Committee on Transport' and the 'Standing Committee on Official Languages'.
Election results
Regina—Qu'Appelle
Canadian federal election, 2015 | ||||||||
|---|---|---|---|---|---|---|---|---|
| Party | Candidate | Votes | % | ±% | Expenditures | |||
| Conservative | Andrew Scheer | 16,486 | 44.70 | -8.49 | $118,170.22 | |||
| New Democratic | Nial Kuyek | 11,144 | 30.21 | -8.44 | $65,386.08 | |||
| Liberal | Della Anaquod | 8,401 | 22.78 | +18.02 | $21,967.01 | |||
| Green | Greg Chatterson | 852 | 2.31 | -0.67 | $3,114.91 | |||
| Total valid votes/Expense limit | 36,883 | 100.0 | $202,239.34 | |||||
| Total rejected ballots | 152 | – | – | |||||
| Turnout | 37,035 | – | – | |||||
| Eligible voters | 52,220 | |||||||
| Source: Elections Canada[10][11] | ||||||||
2011 federal election redistributed results[12] | |||
|---|---|---|---|
| Party | Vote | % | |
| | Conservative | 16,197 | 53.19 |
| | New Democratic | 11,769 | 38.65 |
| | Liberal | 1,449 | 4.76 |
| | Green | 908 | 2.98 |
| | Others | 127 | 0.42 |
Canadian federal election, 2011 | ||||||||
|---|---|---|---|---|---|---|---|---|
| Party | Candidate | Votes | % | ±% | Expenditures | |||
| Conservative | Andrew Scheer | 15,896 | 53.5 | +1.8 | $78,726 | |||
| New Democratic | Fred Clipsham | 11,419 | 38.4 | +6.3 | $63,800 | |||
| Liberal | Jackie Miller | 1,400 | 4.7 | -5.8 | $15,991 | |||
| Green | Greg Chatterson | 879 | 3.0 | -2.8 | $9,100 | |||
| Independent | Jeff Breti | 127 | 0.4 | – | $18,116 | |||
| Total valid votes/Expense limit | 29,721 | 100.0 | $81,793 | |||||
| Total rejected ballots | 97 | 0.3 | 0.0 | |||||
| Turnout | 29,818 | 61.7 | +4 | |||||
| Eligible voters | 48,300 | – | – | |||||
Canadian federal election, 2008 | ||||||||
|---|---|---|---|---|---|---|---|---|
| Party | Candidate | Votes | % | ±% | Expenditures | |||
| Conservative | Andrew Scheer | 14,068 | 51.7 | +10.4 | $78,480 | |||
| New Democratic | Janice Bernier | 8,699 | 32.1 | -0.3 | $44,446 | |||
| Liberal | Rod Flaman | 2,809 | 10.5 | -12.7 | $17,222 | |||
| Green | Greg Chatterson | 1,556 | 5.8 | +2.5 | $8,194 | |||
| Total valid votes/Expense limit | 27,135 | 100.0 | $78,949 | |||||
| Total rejected ballots | 81 | 0.3 | 0.0 | |||||
| Turnout | 27,213 | 57 | -7 | |||||
Canadian federal election, 2006 | ||||||||
|---|---|---|---|---|---|---|---|---|
| Party | Candidate | Votes | % | ±% | Expenditures | |||
| Conservative | Andrew Scheer | 12,753 | 41.3 | +5.5 | $71,773 | |||
| New Democratic | Lorne Nystrom | 10,041 | 32.4 | -0.3 | $50,501 | |||
| Liberal | Allyce Herle | 7,134 | 23.1 | -4.7 | $68,287 | |||
| Green | Brett Dolter | 1,016 | 3.3 | +1.0 | $545 | |||
| Total valid votes | 30,944 | 100.0 | – | |||||
| Total rejected ballots | 93 | 0.3 | 0.0 | |||||
| Turnout | 31,037 | 64 | +8 | |||||
Canadian federal election, 2004 | ||||||||
|---|---|---|---|---|---|---|---|---|
| Party | Candidate | Votes | % | ±% | Expenditures | |||
| Conservative | Andrew Scheer | 10,012 | 35.8 | -5.0 | $68,776 | |||
| New Democratic | Lorne Nystrom | 9,151 | 32.7 | -8.6 | $46,290 | |||
| Liberal | Allyce Herle | 7,793 | 27.8 | +9.9 | $54,913 | |||
| Green | Deanna Robilliard | 639 | 2.3 | – | | |||
| Christian Heritage | Mary Sylvia Nelson | 293 | 1.0 | – | $4,213 | |||
| Independent | Lorne Edward Widger | 106 | 0.4 | – | $728 | |||
| Total valid votes | 27,994 | 100.0 | – | |||||
| Total rejected ballots | 89 | 0.3 | -0.2 | |||||
| Turnout | 28,083 | 56.2 | -4.9 | |||||
Note: Conservative vote is compared to the Canadian Alliance vote in 2000 election.
Canadian federal election, 2000 | ||||||||
|---|---|---|---|---|---|---|---|---|
| Party | Candidate | Votes | % | ±% | Expenditures | |||
| New Democratic | Lorne Nystrom | 11,731 | 41.3 | -1.1 | $57,492 | |||
| Alliance | Don Leier | 11,567 | 40.7 | +13.8 | $34,106 | |||
| Liberal | Melvin Isnana | 5,106 | 18.0 | -5.8 | $41,445 | |||
| Total valid votes | 28,404 | 100.0 | – | |||||
| Total rejected ballots | 141 | 0.5 | -0.1 | |||||
| Turnout | 28,545 | 61.1 | -1.7 | |||||
Note: Canadian Alliance vote is compared to the Reform vote in 1997 election.
Qu'Appelle, 1988–2000
Canadian federal election, 1997 | ||||||||
|---|---|---|---|---|---|---|---|---|
| Party | Candidate | Votes | % | ±% | Expenditures | |||
| New Democratic | Lorne Nystrom | 12,269 | 42.4 | +7.9 | $59,376 | |||
| Reform | Les Winter | 7,784 | 26.9 | +4.4 | $55,562 | |||
| Liberal | Don Ross | 6,868 | 23.7 | -7.4 | $37,643 | |||
| Progressive Conservative | Roy Gaebel | 1,633 | 5.6 | -4.4 | $13,911 | |||
| Canadian Action | Greg Chatterson | 382 | 1.3 | – | | |||
| Total valid votes | 28,936 | 100.0 | – | |||||
| Total rejected ballots | 143 | 0.6 | +0.1 | |||||
| Turnout | 29,079 | 62.8 | ||||||
Canadian federal election, 1993 | ||||||||
|---|---|---|---|---|---|---|---|---|
| Party | Candidate | Votes | % | ±% | ||||
| New Democratic | Simon De Jong | 11,178 | 34.5 | -19.4 | ||||
| Liberal | Reina Sinclair | 10,071 | 31.1 | +16.5 | ||||
| Reform | Kerry Gray | 7,286 | 22.5 | | ||||
| Progressive Conservative | Tom Hull | 3,262 | 10.1 | -21.4 | ||||
| National | Jenny Watson | 392 | 1.2 | | ||||
| Canada Party | Joseph Thauberger | 178 | 0.5 | | ||||
| Total valid votes | 32,367 | 100.0 | ||||||
Canadian federal election, 1988 | ||||||||
|---|---|---|---|---|---|---|---|---|
| Party | Candidate | Votes | % | |||||
| New Democratic | Simon De Jong | 18,608 | 54.0 | |||||
| Progressive Conservative | William Lawrence Hicke | 10,854 | 31.5 | |||||
| Liberal | Larry Smith | 5,028 | 14.6 | |||||
| Total valid votes | 34,490 | 100.0 | ||||||
Qu'Appelle, 1904–1968
Canadian federal election, 1965 | ||||||||
|---|---|---|---|---|---|---|---|---|
| Party | Candidate | Votes | % | ±% | ||||
| Progressive Conservative | Alvin Hamilton | 9,579 | 57.5 | -2.6 | ||||
| Liberal | Charlie Lenz | 4,033 | 24.2 | -0.1 | ||||
| New Democratic | Clif Argue | 2,658 | 16.0 | +4.5 | ||||
| Social Credit | Wilfred Totten | 375 | 2.3 | -1.9 | ||||
| Total valid votes | 16,645 | 100.0 | ||||||
Canadian federal election, 1963 | ||||||||
|---|---|---|---|---|---|---|---|---|
| Party | Candidate | Votes | % | ±% | ||||
| Progressive Conservative | Alvin Hamilton | 10,690 | 60.2 | +1.7 | ||||
| Liberal | L.L. Prefontaine | 4,312 | 24.3 | +0.8 | ||||
| New Democratic | Norman Kennedy | 2,028 | 11.4 | -0.6 | ||||
| Social Credit | Edwin Fredlund | 729 | 4.1 | -2.0 | ||||
| Total valid votes | 17,759 | 100.0 | ||||||
Canadian federal election, 1962 | ||||||||
|---|---|---|---|---|---|---|---|---|
| Party | Candidate | Votes | % | ±% | ||||
| Progressive Conservative | Alvin Hamilton | 10,680 | 58.5 | -0.6 | ||||
| Liberal | L.L. Prefontaine | 4,291 | 23.5 | -1.0 | ||||
| New Democratic | Harry E. Richardson | 2,188 | 12.0 | -4.5 | ||||
| Social Credit | Herman A. Hauser | 1,113 | 6.1 | | ||||
| Total valid votes | 18,272 | 100.0 | ||||||
Note: NDP vote is compared to CCF vote in 1958 election.
Canadian federal election, 1958 | ||||||||
|---|---|---|---|---|---|---|---|---|
| Party | Candidate | Votes | % | ±% | ||||
| Progressive Conservative | Alvin Hamilton | 10,514 | 59.0 | +24.8 | ||||
| Liberal | Thomas Kearns | 4,357 | 24.5 | -5.9 | ||||
| Co-operative Commonwealth | Norman Kennedy | 2,941 | 16.5 | -7.1 | ||||
| Total valid votes | 17,812 | 100.0 | ||||||
Canadian federal election, 1957 | ||||||||
|---|---|---|---|---|---|---|---|---|
| Party | Candidate | Votes | % | ±% | ||||
| Progressive Conservative | Alvin Hamilton | 6,217 | 34.2 | +7.1 | ||||
| Liberal | Henry Philip Mang | 5,512 | 30.4 | -8.1 | ||||
| Co-operative Commonwealth | Norman Kennedy | 4,279 | 23.6 | -7.3 | ||||
| Social Credit | David Isman | 2,150 | 11.8 | +8.3 | ||||
| Total valid votes | 18,158 | 100.0 | ||||||
Canadian federal election, 1953 | ||||||||
|---|---|---|---|---|---|---|---|---|
| Party | Candidate | Votes | % | ±% | ||||
| Liberal | Henry Philip Mang | 6,988 | 38.5 | -6.3 | ||||
| Co-operative Commonwealth | Lawrence Irwin Hockley | 5,612 | 30.9 | -7.0 | ||||
| Progressive Conservative | Alvin Hamilton | 4,930 | 27.1 | +9.7 | ||||
| Social Credit | Anton Edward Kovatch | 644 | 3.5 | |||||
| Total valid votes | 18,174 | 100.0 | ||||||
Canadian federal election, 1949 | ||||||||
|---|---|---|---|---|---|---|---|---|
| Party | Candidate | Votes | % | ±% | ||||
| Liberal | Austin Edwin Dewar | 9,017 | 44.7 | +15.1 | ||||
| Co-operative Commonwealth | Gladys Strum | 7,629 | 37.8 | +0.4 | ||||
| Progressive Conservative | Rhys Graham Williams | 3,519 | 17.5 | -15.5 | ||||
| Total valid votes | 20,165 | 100.0 | ||||||
Canadian federal election, 1945 | ||||||||
|---|---|---|---|---|---|---|---|---|
| Party | Candidate | Votes | % | ±% | ||||
| Co-operative Commonwealth | Gladys Strum | 6,146 | 37.4 | | ||||
| Progressive Conservative | Ernest Edward Perley | 5,415 | 33.0 | -21.9 | ||||
| Liberal | Gen. Andrew George Latta McNaughton | 4,871 | 29.6 | -15.5 | ||||
| Total valid votes | 16,432 | 100.0 | ||||||
Note: Progressive Conservative vote is compared to "National Government" vote in 1940 election. Social Credit vote is compared to New Democracy vote in 1940 election.
Canadian federal election, 1940 | ||||||||
|---|---|---|---|---|---|---|---|---|
| Party | Candidate | Votes | % | ±% | ||||
| National Government | Ernest Edward Perley | 8,236 | 54.9 | +18.2 | ||||
| Liberal | James Alexander McCowan | 6,775 | 45.1 | +9.7 | ||||
| Total valid votes | 15,011 | 100.0 | ||||||
Note: "National Government" vote is compared to Conservative vote in 1935 election.
Canadian federal election, 1935 | ||||||||
|---|---|---|---|---|---|---|---|---|
| Party | Candidate | Votes | % | ±% | ||||
| Conservative | Ernest Edward Perley | 5,769 | 36.6 | | ||||
| Liberal | James Alexander McCowan | 5,579 | 35.4 | -17.9 | ||||
| Co-operative Commonwealth | John Frederick Herman | 2,210 | 14.0 | | ||||
| Social Credit | Joseph Alois Thauberger | 2,186 | 13.9 | | ||||
| Total valid votes | 15,744 | 100.0 | ||||||
Canadian federal election, 1930 | ||||||||
|---|---|---|---|---|---|---|---|---|
| Party | Candidate | Votes | % | ±% | ||||
| Liberal | Ernest Edward Perley | 7,888 | 53.3 | | ||||
| Liberal–Progressive | John Millar | 6,905 | 46.7 | -10.2 | ||||
| Total valid votes | 14,793 | 100.0 | ||||||
Canadian federal election, 1926 | ||||||||
|---|---|---|---|---|---|---|---|---|
| Party | Candidate | Votes | % | ±% | ||||
| Liberal–Progressive | John Millar | 7,778 | 56.9 | +3.5 | ||||
| Conservative | William Wallace Lynd | 5,891 | 43.1 | -3.5 | ||||
| Total valid votes | 13,669 | 100.0 | ||||||
Note: Liberal-Progressive vote is compared to Progressive vote in 1925 election.
Canadian federal election, 1925 | ||||||||
|---|---|---|---|---|---|---|---|---|
| Party | Candidate | Votes | % | ±% | ||||
| Progressive | John Millar | 5,272 | 53.4 | -15.9 | ||||
| Conservative | William Wallace Lynd | 4,600 | 46.6 | +15.9 | ||||
| Total valid votes | 9,872 | 100.0 | ||||||
Canadian federal election, 1921 | ||||||||
|---|---|---|---|---|---|---|---|---|
| Party | Candidate | Votes | % | |||||
| Progressive | John Millar | 8,350 | 69.3 | |||||
| Conservative | Ernest Edward Perley | 3,705 | 30.7 | |||||
| Total valid votes | 12,055 | 100.0 | ||||||
Canadian federal election, 1917 | ||||||||
|---|---|---|---|---|---|---|---|---|
| Party | Candidate | Votes | ||||||
| Government (Unionist) | Levi Thomson | acclaimed | ||||||
Canadian federal election, 1911 | ||||||||
|---|---|---|---|---|---|---|---|---|
| Party | Candidate | Votes | % | ±% | ||||
| Liberal | Levi Thomson | 4,298 | 52.6 | +2.9 | ||||
| Conservative | Richard Stuart Lake | 3,874 | 47.4 | -2.9 | ||||
| Total valid votes | 8,172 | 100.0 | ||||||
Canadian federal election, 1908 | ||||||||
|---|---|---|---|---|---|---|---|---|
| Party | Candidate | Votes | % | |||||
| Conservative | Richard Stuart Lake | 3,833 | 50.3 | |||||
| Liberal | J.T. Brown | 3,781 | 49.7 | |||||
| Total valid votes | 7,614 | 100.0 | ||||||
See also
- List of Canadian federal electoral districts
- Past Canadian electoral districts
References
"(Code 47008) Census Profile". 2011 census. Statistics Canada. 2012. Retrieved 2011-03-03..mw-parser-output cite.citation{font-style:inherit}.mw-parser-output .citation q{quotes:"""""""'""'"}.mw-parser-output .citation .cs1-lock-free a{background:url("//upload.wikimedia.org/wikipedia/commons/thumb/6/65/Lock-green.svg/9px-Lock-green.svg.png")no-repeat;background-position:right .1em center}.mw-parser-output .citation .cs1-lock-limited a,.mw-parser-output .citation .cs1-lock-registration a{background:url("//upload.wikimedia.org/wikipedia/commons/thumb/d/d6/Lock-gray-alt-2.svg/9px-Lock-gray-alt-2.svg.png")no-repeat;background-position:right .1em center}.mw-parser-output .citation .cs1-lock-subscription a{background:url("//upload.wikimedia.org/wikipedia/commons/thumb/a/aa/Lock-red-alt-2.svg/9px-Lock-red-alt-2.svg.png")no-repeat;background-position:right .1em center}.mw-parser-output .cs1-subscription,.mw-parser-output .cs1-registration{color:#555}.mw-parser-output .cs1-subscription span,.mw-parser-output .cs1-registration span{border-bottom:1px dotted;cursor:help}.mw-parser-output .cs1-ws-icon a{background:url("//upload.wikimedia.org/wikipedia/commons/thumb/4/4c/Wikisource-logo.svg/12px-Wikisource-logo.svg.png")no-repeat;background-position:right .1em center}.mw-parser-output code.cs1-code{color:inherit;background:inherit;border:inherit;padding:inherit}.mw-parser-output .cs1-hidden-error{display:none;font-size:100%}.mw-parser-output .cs1-visible-error{font-size:100%}.mw-parser-output .cs1-maint{display:none;color:#33aa33;margin-left:0.3em}.mw-parser-output .cs1-subscription,.mw-parser-output .cs1-registration,.mw-parser-output .cs1-format{font-size:95%}.mw-parser-output .cs1-kern-left,.mw-parser-output .cs1-kern-wl-left{padding-left:0.2em}.mw-parser-output .cs1-kern-right,.mw-parser-output .cs1-kern-wl-right{padding-right:0.2em}
Notes
^ Statistics Canada: 2012
^ Statistics Canada: 2012
^ http://www12.statcan.gc.ca/nhs-enm/2011/dp-pd/prof/details/page.cfm?Lang=E&Geo1=FED2013&Code1=47008&Data=Count&SearchText=Regina&SearchType=Begins&SearchPR=01&A1=All&B1=All&Custom=&TABID=1
^ http://www12.statcan.gc.ca/nhs-enm/2011/dp-pd/prof/details/page.cfm?Lang=E&Geo1=FED2013&Code1=47008&Data=Count&SearchText=Regina&SearchType=Begins&SearchPR=01&A1=All&B1=All&Custom=&TABID=1#tabs2
^ "Qq'Appelle, Saskatchewan (1905 - 1966)". History of Federal Ridings since 1867. Retrieved 2009-05-08.
^ "Qu'Appelle—Moose Mountain, Saskatchewan (1966 - 1987)". History of Federal Ridings since 1867. Retrieved 2009-05-08.
^ "Regina—Qu'Appelle, Saskatchewan (1987 - 1996)". History of Federal Ridings since 1867. Retrieved 2009-05-08.
^ "Qu'Appelle, Saskatchewan (1996 - 1998)". History of Federal Ridings since 1867. Retrieved 2009-05-08.
^ "Regina—Qu'Appelle, Saskatchewan (1998 - )". History of Federal Ridings since 1867. Retrieved 2009-05-08.
^ Elections Canada – Confirmed candidates for Regina—Qu'Appelle, 30 September 2015
^ Elections Canada – Preliminary Election Expenses Limits for Candidates
^ Pundits' Guide to Canadian Elections
External links
Riding history for Qu'Appelle, Northwest Territories (1903–1905) from the Library of Parliament
Riding history for Qu'Appelle, Saskatchewan (1905–1966) from the Library of Parliament
Riding history for Regina–Qu'Appelle (1987–1996) from the Library of Parliament
Riding history for Qu'Appelle (1996–1998) from the Library of Parliament
Riding history for Regina–Qu'Appelle (1998– ) from the Library of Parliament
- Expenditures - 2008
- Expenditures - 2004
- Expenditures - 2000
- Expenditures - 1997
.mw-parser-output .navbox-canada .navbox-title,.mw-parser-output .navbox-canada th,.mw-parser-output .navbox-canada .navbox-group,.mw-parser-output .navbox-canada .navbox-abovebelow,.mw-parser-output .navbox-canada .navbox-subgroup,.mw-parser-output .navbox-canada .navbox-odd,.mw-parser-output .navbox-canada .navbox-even{background-color:white}.mw-parser-output .navbox-canada .navbox-list .collapsible .navbox-title{box-shadow:inset 1px 1px 0 #C00,inset -1px -1px 0 #C00}.mw-parser-output .navbox-canada-a{box-shadow:inset 1px 1px 0 #C00,inset -1px -1px 0 #C00}.mw-parser-output .navbox-canada-t{box-shadow:inset 0 1px 0 0 #C00}.mw-parser-output .navbox-canada-b{box-shadow:inset 0 -1px 0 0 #C00}.mw-parser-output .navbox-canada-tb{box-shadow:inset 0 1px 0 0 #C00,inset 0 -1px 0 0 #C00} Federal ridings in Saskatchewan | ||
|---|---|---|
| Conservative |
|  |
| New Democratic |
| |
| Liberal |
| |
| Co-operative Commonwealth |
| |


