Pamban
Pamban பாம்பன் | |
|---|---|
Town | |
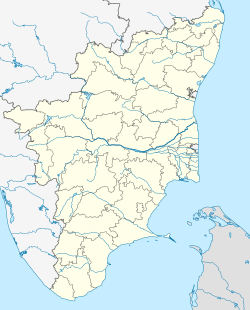 Pamban Location in Tamil Nadu, India Show map of Tamil Nadu  Pamban Pamban (India) Show map of India | |
| Coordinates: 9°17′N 79°12′E / 9.283°N 79.200°E / 9.283; 79.200Coordinates: 9°17′N 79°12′E / 9.283°N 79.200°E / 9.283; 79.200 | |
| Country | |
| State | Tamil Nadu |
| District | Ramanathapuram |
| Population (2001) | |
| • Total | 30,926 |
| Languages | |
| • Official | Tamil |
| Time zone | UTC+5:30 (IST) |
Pamban is a town in the Rameswaram taluk of Ramanathapuram district, Tamil Nadu. It is at the west edge of Pamban Island and is a popular fishing port. The town gives its name to the whole island. Pamban railway station is the first station on the island for pilgrims travelling to Rameswaram.
Demographics
As per the 2001 census,[1] Pamban had a population of 30,926 with 15,919 males and 15,007 females. The sex ratio was 943 and the literacy rate, 76.97.[citation needed]
Climate
Pamban has a tropical savanna climate (Köppen climate classification Aw) with hot summers and cool winters. Unlike most locations in India with this climate, most rainfall occurs in autumn and winter, with the heaviest rain falling from October to December, and very little rain in the summer months of June to August.[citation needed]
| Climate data for Pamban | |||||||||||||
|---|---|---|---|---|---|---|---|---|---|---|---|---|---|
| Month | Jan | Feb | Mar | Apr | May | Jun | Jul | Aug | Sep | Oct | Nov | Dec | Year |
| Record high °C (°F) | 31.7 (89.1) | 34.0 (93.2) | 35.2 (95.4) | 36.8 (98.2) | 36.0 (96.8) | 36.4 (97.5) | 35.8 (96.4) | 37.3 (99.1) | 35.5 (95.9) | 34.4 (93.9) | 33.2 (91.8) | 31.6 (88.9) | 37.3 (99.1) |
| Average high °C (°F) | 28.6 (83.5) | 30.3 (86.5) | 32.1 (89.8) | 33.8 (92.8) | 34.0 (93.2) | 33.0 (91.4) | 33.0 (91.4) | 32.6 (90.7) | 32.5 (90.5) | 31.7 (89.1) | 30.0 (86.0) | 28.5 (83.3) | 31.7 (89.0) |
| Daily mean °C (°F) | 26.3 (79.3) | 27.0 (80.6) | 28.5 (83.3) | 30.5 (86.9) | 30.9 (87.6) | 30.2 (86.4) | 29.9 (85.8) | 29.5 (85.1) | 29.3 (84.7) | 28.6 (83.5) | 27.4 (81.3) | 26.3 (79.3) | 28.7 (83.6) |
| Average low °C (°F) | 23.9 (75.0) | 23.8 (74.8) | 24.8 (76.6) | 27.1 (80.8) | 27.8 (82.0) | 27.3 (81.1) | 26.7 (80.1) | 26.3 (79.3) | 26.0 (78.8) | 25.5 (77.9) | 24.7 (76.5) | 24.1 (75.4) | 25.7 (78.2) |
| Record low °C (°F) | 18.9 (66.0) | 18.8 (65.8) | 19.5 (67.1) | 20.8 (69.4) | 21.2 (70.2) | 21.8 (71.2) | 22.2 (72.0) | 19.8 (67.6) | 22.0 (71.6) | 19.8 (67.6) | 20.8 (69.4) | 19.0 (66.2) | 18.8 (65.8) |
| Average precipitation mm (inches) | 49 (1.9) | 25 (1.0) | 17 (0.7) | 39 (1.5) | 48 (1.9) | 2 (0.1) | 18 (0.7) | 9 (0.4) | 29 (1.1) | 224 (8.8) | 240 (9.4) | 212 (8.3) | 912 (35.8) |
| Average rainy days | 3.5 | 1.4 | 2.1 | 3.0 | 2.9 | 0.4 | 1.2 | 1.0 | 2.3 | 9.8 | 12.8 | 10.3 | 50.7 |
| Average relative humidity (%) | 77 | 74 | 72 | 73 | 75 | 75 | 74 | 75 | 76 | 78 | 80 | 82 | 76 |
| Source: NOAA (1971-1990) [2] | |||||||||||||
References
^ "Primary Census Abstract - Census 2001". Directorate of Census Operations-Tamil Nadu. Archived from the original on 2011-02-17..mw-parser-output cite.citation{font-style:inherit}.mw-parser-output .citation q{quotes:"""""""'""'"}.mw-parser-output .citation .cs1-lock-free a{background:url("//upload.wikimedia.org/wikipedia/commons/thumb/6/65/Lock-green.svg/9px-Lock-green.svg.png")no-repeat;background-position:right .1em center}.mw-parser-output .citation .cs1-lock-limited a,.mw-parser-output .citation .cs1-lock-registration a{background:url("//upload.wikimedia.org/wikipedia/commons/thumb/d/d6/Lock-gray-alt-2.svg/9px-Lock-gray-alt-2.svg.png")no-repeat;background-position:right .1em center}.mw-parser-output .citation .cs1-lock-subscription a{background:url("//upload.wikimedia.org/wikipedia/commons/thumb/a/aa/Lock-red-alt-2.svg/9px-Lock-red-alt-2.svg.png")no-repeat;background-position:right .1em center}.mw-parser-output .cs1-subscription,.mw-parser-output .cs1-registration{color:#555}.mw-parser-output .cs1-subscription span,.mw-parser-output .cs1-registration span{border-bottom:1px dotted;cursor:help}.mw-parser-output .cs1-ws-icon a{background:url("//upload.wikimedia.org/wikipedia/commons/thumb/4/4c/Wikisource-logo.svg/12px-Wikisource-logo.svg.png")no-repeat;background-position:right .1em center}.mw-parser-output code.cs1-code{color:inherit;background:inherit;border:inherit;padding:inherit}.mw-parser-output .cs1-hidden-error{display:none;font-size:100%}.mw-parser-output .cs1-visible-error{font-size:100%}.mw-parser-output .cs1-maint{display:none;color:#33aa33;margin-left:0.3em}.mw-parser-output .cs1-subscription,.mw-parser-output .cs1-registration,.mw-parser-output .cs1-format{font-size:95%}.mw-parser-output .cs1-kern-left,.mw-parser-output .cs1-kern-wl-left{padding-left:0.2em}.mw-parser-output .cs1-kern-right,.mw-parser-output .cs1-kern-wl-right{padding-right:0.2em}
^ "Pamban Climate Normals 1971-1990". National Oceanic and Atmospheric Administration. Retrieved 25 December 2012.


