Bismarck–Mandan

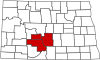
Location of the Bismarck Metropolitan Statistical Area in North Dakota
Bismarck–Mandan refers to the metropolitan area (known as the "Bismarck, ND Metropolitan Statistical Area") composed of Burleigh, Morton, Oliver, and Sioux counties in the state of North Dakota. It is sometimes referred to as the Bisman area.
Its core cities are Bismarck and Mandan, which are across from each other on opposite sides of the upper Missouri River. Lincoln, is an adjacent suburb of Bismarck. The 2016 population of the MSA was estimated at 131,635. The area grew considerably with the addition of Oliver and Sioux counties in 2013. However, with relatively sparse populations, the addition of Oliver and Sioux counties only added approximately 6,000 people to the metropolitan population. The 2016 Bismarck–Mandan–Lincoln urban population is estimated at 98,776.
Contents
1 Counties
2 Core Cities
3 Other Cities and Towns
4 Demographics
5 References
Counties
In 2013 the Office of Management and Budget revised the definitions of metropolitan statistical areas; the Bismarck–Mandan MSA was enlarged by the inclusion of Oliver and Sioux counties from that year.[1]
- Burleigh County
- Morton County
- Oliver County
- Sioux County
Core Cities
Bismarck (72,417)
Mandan (21,769)
| Historical population | |||
|---|---|---|---|
| Census | Pop. | %± | |
| 1880 | 3,446 | — | |
| 1890 | 8,975 | 160.4% | |
| 1900 | 14,150 | 57.7% | |
| 1910 | 38,376 | 171.2% | |
| 1920 | 34,292 | −10.6% | |
| 1930 | 39,416 | 14.9% | |
| 1940 | 42,920 | 8.9% | |
| 1950 | 44,968 | 4.8% | |
| 1960 | 55,008 | 22.3% | |
| 1970 | 61,024 | 10.9% | |
| 1980 | 79,988 | 31.1% | |
| 1990 | 83,831 | 4.8% | |
| 2000 | 94,719 | 13.0% | |
| 2010 | 108,779 | 14.8% | |
| Est. 2016 | 131,635 | 21.0% | |
| U.S. Decennial Census[2] 2016 Estimate[3] | |||
Other Cities and Towns
- Almont
- Baldwin
- Bluegrass
- Breien
- Cannon Ball
- Center
- Chadwick
- Dengate
- Driscoll
- Eagle Nest
- Fallon
- Flasher
- Fort Rice
- Fort Yates
- Glen Ullin
- Hannover
- Harmon
- Hebron
- Hensler
- Huff
- Judson
- Lincoln
- Lynwood
- Lyons
- McKenzie
- Menoken
- Moffit
- New Salem
- North Almot
- Otter Creek
- Pierce
- Porcupine
- Price
- Regan
- Rock Haven
- Saint Anthony
- Sanger
- Schmidt
- Selfridge
- Sims
- Sterling
- Sunny
- Solen
- Sweet Briar
- Timmer
- Wilton
- Wing
- Youngtown
Demographics
As of the census of 2000, there were 94,719 people, 37,559 households, and 25,138 families residing within the MSA. The racial makeup of the MSA was 95.24% White, 0.23% African American, 3.04% Native American, 0.37% Asian, 0.02% Pacific Islander, 0.16% from other races, and 0.93% from two or more races. Hispanic or Latino of any race were 0.67% of the population.
The median income for a household in the MSA was $39,169, and the median income for a family was $48,339. Males had a median income of $32,726 versus $21,364 for females. The per capita income for the MSA was $18,819.
References
^ "Revised Delineations of Metropolitan Statistical Areas, Micropolitan Statistical Areas, and Combined Statistical Areas, and Guidance on Uses of the Delineations of These Areas" (PDF). Office of Management and Budget. February 28, 2013. Archived from the original (pdf) on 2016-02-01. Retrieved February 4, 2016..mw-parser-output cite.citation{font-style:inherit}.mw-parser-output .citation q{quotes:"""""""'""'"}.mw-parser-output .citation .cs1-lock-free a{background:url("//upload.wikimedia.org/wikipedia/commons/thumb/6/65/Lock-green.svg/9px-Lock-green.svg.png")no-repeat;background-position:right .1em center}.mw-parser-output .citation .cs1-lock-limited a,.mw-parser-output .citation .cs1-lock-registration a{background:url("//upload.wikimedia.org/wikipedia/commons/thumb/d/d6/Lock-gray-alt-2.svg/9px-Lock-gray-alt-2.svg.png")no-repeat;background-position:right .1em center}.mw-parser-output .citation .cs1-lock-subscription a{background:url("//upload.wikimedia.org/wikipedia/commons/thumb/a/aa/Lock-red-alt-2.svg/9px-Lock-red-alt-2.svg.png")no-repeat;background-position:right .1em center}.mw-parser-output .cs1-subscription,.mw-parser-output .cs1-registration{color:#555}.mw-parser-output .cs1-subscription span,.mw-parser-output .cs1-registration span{border-bottom:1px dotted;cursor:help}.mw-parser-output .cs1-ws-icon a{background:url("//upload.wikimedia.org/wikipedia/commons/thumb/4/4c/Wikisource-logo.svg/12px-Wikisource-logo.svg.png")no-repeat;background-position:right .1em center}.mw-parser-output code.cs1-code{color:inherit;background:inherit;border:inherit;padding:inherit}.mw-parser-output .cs1-hidden-error{display:none;font-size:100%}.mw-parser-output .cs1-visible-error{font-size:100%}.mw-parser-output .cs1-maint{display:none;color:#33aa33;margin-left:0.3em}.mw-parser-output .cs1-subscription,.mw-parser-output .cs1-registration,.mw-parser-output .cs1-format{font-size:95%}.mw-parser-output .cs1-kern-left,.mw-parser-output .cs1-kern-wl-left{padding-left:0.2em}.mw-parser-output .cs1-kern-right,.mw-parser-output .cs1-kern-wl-right{padding-right:0.2em}
^ United States Census Bureau. "Census of Population and Housing". Archived from the original on May 12, 2015. Retrieved February 5, 2014.
^ "Annual Estimates of the Population of Metropolitan and Micropolitan Statistical Areas: April 1, 2010 to July 1, 2012". Retrieved March 26, 2015.
| Counties |
|  |
|---|---|---|
| Core cities |
| |
| Surrounding areas |
| |
†-county seat | ||
Coordinates: 46°49′N 100°50′W / 46.817°N 100.833°W / 46.817; -100.833


