Lawrence County, Illinois
Lawrence County, Illinois | |
|---|---|
 Lawrence County Courthouse in Lawrenceville | |
 Location within the U.S. state of Illinois | |
 Illinois's location within the U.S. | |
| Founded | 1821 |
| Named for | James Lawrence |
| Seat | Lawrenceville |
| Largest city | Lawrenceville |
| Area | |
| • Total | 374 sq mi (969 km2) |
| • Land | 372 sq mi (963 km2) |
| • Water | 2.0 sq mi (5 km2), 0.5% |
| Population | |
| • (2010) | 16,833 |
| • Density | 45/sq mi (17/km2) |
| Congressional district | 15th |
| Time zone | Eastern: UTC−5/−4 |
| Website | www.lawrencecounty illinois.com |
Lawrence County is the easternmost county in the U.S. state of Illinois (excluding water boundaries). According to the 2010 census, it has a population of 16,833.[1] Its county seat is Lawrenceville.[2]
Contents
1 History
2 Geography
2.1 Climate and weather
2.2 Major highways
2.3 Adjacent counties
3 Demographics
4 Communities
4.1 Cities
4.2 Village
4.3 Unincorporated communities
4.4 Townships
5 Politics
6 See also
7 References
8 External links
History
Lawrence County was formed in 1821 out of Crawford and Edwards counties. It was named for Captain James Lawrence, who was killed in action during the War of 1812 while commanding the frigate USS Chesapeake.[3] Mortally wounded, he gave his men the famous last order, "Don't give up the ship."
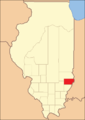
Lawrence County from its creation in 1821 to 1824

Lawrence County between 1824 and 1841
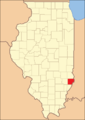
Lawrence County in 1841, when the creation of Richland County reduced Lawrence to its current size


Geography
According to the U.S. Census Bureau, the county has a total area of 374 square miles (970 km2), of which 372 square miles (960 km2) is land and 2.0 square miles (5.2 km2) (0.5%) is water.[4]
Climate and weather
Lawrenceville, Illinois | ||||||||||||||||||||||||||||||||||||||||||||||||||||||||||||
|---|---|---|---|---|---|---|---|---|---|---|---|---|---|---|---|---|---|---|---|---|---|---|---|---|---|---|---|---|---|---|---|---|---|---|---|---|---|---|---|---|---|---|---|---|---|---|---|---|---|---|---|---|---|---|---|---|---|---|---|---|
| Climate chart (explanation) | ||||||||||||||||||||||||||||||||||||||||||||||||||||||||||||
| ||||||||||||||||||||||||||||||||||||||||||||||||||||||||||||
| ||||||||||||||||||||||||||||||||||||||||||||||||||||||||||||
In recent years, average temperatures in the county seat of Lawrenceville have ranged from a low of 18 °F (−8 °C) in January to a high of 88 °F (31 °C) in July, although a record low of −26 °F (−32 °C) was recorded in January 1994 and a record high of 104 °F (40 °C) was recorded in June 1988. Average monthly precipitation ranged from 2.51 inches (64 mm) in February to 5.13 inches (130 mm) in May.[5]
Major highways
 U.S. Route 50
 Illinois Route 1
 Illinois Route 33
 Illinois Route 250
Adjacent counties
Crawford County - north
Knox County, Indiana - east
Wabash County - south
Richland County - west
Demographics
| Historical population | |||
|---|---|---|---|
| Census | Pop. | %± | |
| 1830 | 3,668 | — | |
| 1840 | 7,092 | 93.3% | |
| 1850 | 6,121 | −13.7% | |
| 1860 | 9,214 | 50.5% | |
| 1870 | 12,533 | 36.0% | |
| 1880 | 13,663 | 9.0% | |
| 1890 | 14,693 | 7.5% | |
| 1900 | 16,523 | 12.5% | |
| 1910 | 22,661 | 37.1% | |
| 1920 | 21,380 | −5.7% | |
| 1930 | 21,885 | 2.4% | |
| 1940 | 21,075 | −3.7% | |
| 1950 | 20,539 | −2.5% | |
| 1960 | 18,540 | −9.7% | |
| 1970 | 17,522 | −5.5% | |
| 1980 | 17,807 | 1.6% | |
| 1990 | 15,972 | −10.3% | |
| 2000 | 15,452 | −3.3% | |
| 2010 | 16,833 | 8.9% | |
| Est. 2016 | 16,377 | [6] | −2.7% |
| U.S. Decennial Census[7] 1790-1960[8] 1900-1990[9] 1990-2000[10] 2010-2013[1] | |||
@media all and (max-width:720px){.mw-parser-output .mobile-float-reset{float:none!important;width:100%!important}}.mw-parser-output .stack-container{box-sizing:border-box}.mw-parser-output .stack-clear-left{float:left;clear:left}.mw-parser-output .stack-clear-right{float:right;clear:right}.mw-parser-output .stack-left{float:left}.mw-parser-output .stack-right{float:right}.mw-parser-output .stack-object{margin:1px;overflow:hidden}

As of the 2010 United States Census, there were 16,833 people, 6,130 households, and 4,056 families residing in the county.[11] The population density was 45.2 inhabitants per square mile (17.5/km2). There were 6,936 housing units at an average density of 18.6 per square mile (7.2/km2).[4] The racial makeup of the county was 87.3% white, 9.6% black or African American, 0.2% Asian, 0.2% American Indian, 1.7% from other races, and 1.0% from two or more races. Those of Hispanic or Latino origin made up 3.3% of the population.[11] In terms of ancestry, 12.7% were German, 10.4% were American, 9.5% were Irish, and 7.8% were English.[12]
Of the 6,130 households, 28.6% had children under the age of 18 living with them, 50.7% were married couples living together, 10.7% had a female householder with no husband present, 33.8% were non-families, and 30.1% of all households were made up of individuals. The average household size was 2.34 and the average family size was 2.88. The median age was 39.7 years.[11]
The median income for a household in the county was $38,771 and the median income for a family was $45,565. Males had a median income of $40,949 versus $25,991 for females. The per capita income for the county was $19,297. About 14.8% of families and 17.5% of the population were below the poverty line, including 26.9% of those under age 18 and 7.7% of those age 65 or over.[13]
Communities
Cities
- Bridgeport
- Lawrenceville
- St. Francisville
- Sumner
Village
- Russellville
Unincorporated communities
- Billett
- Birds
- Chauncey
- Helena
- Petrolia
- Pinkstaff
- Russelville
- Sand Barrens
- Westport
Townships
Nine townships make up Lawrence County. They are:
- Allison
- Bond
- Bridgeport
- Christy
- Denison
- Lawrence
- Lukin
- Petty
- Russell
Politics
In its early days, Lawrence County was a Democratic-leaning swing county, voting Republican only twice up to 1892 when it supported Ulysses S. Grant in 1872 and Benjamin Harrison in 1888. It did not vote for a losing Republican candidate until Wendell Willkie carried the county in 1940 due to isolationist sentiment. Since that time, however, Lawrence County – like so many in Southern Illinois – has become powerfully Republican due to opposition to Democratic Party social liberalism.[14] The only Democrat to gain an absolute majority in the county since 1936 has been Lyndon Johnson in 1964, although Bill Clinton obtained pluralities in both 1992 and 1996.
| Year | Republican | Democratic | Third parties |
|---|---|---|---|
2016 | 74.6% 4,521 | 21.3% 1,290 | 4.1% 247 |
2012 | 64.4% 3,857 | 33.6% 2,011 | 2.0% 121 |
2008 | 51.9% 3,403 | 46.0% 3,016 | 2.1% 139 |
2004 | 61.9% 4,162 | 37.4% 2,518 | 0.7% 49 |
2000 | 54.6% 3,594 | 42.9% 2,822 | 2.5% 162 |
1996 | 40.2% 2,568 | 44.9% 2,871 | 14.9% 953 |
1992 | 35.8% 2,681 | 43.7% 3,270 | 20.5% 1,537 |
1988 | 53.6% 3,655 | 46.0% 3,140 | 0.4% 28 |
1984 | 61.4% 4,686 | 38.3% 2,924 | 0.4% 28 |
1980 | 56.7% 4,453 | 38.6% 3,030 | 4.8% 373 |
1976 | 51.5% 4,345 | 47.9% 4,044 | 0.6% 53 |
1972 | 65.4% 5,347 | 34.5% 2,818 | 0.2% 16 |
1968 | 54.6% 4,883 | 34.4% 3,075 | 11.1% 988 |
1964 | 44.9% 4,176 | 55.2% 5,136 | |
1960 | 62.5% 6,120 | 37.4% 3,667 | 0.1% 13 |
1956 | 61.9% 6,104 | 38.0% 3,751 | 0.1% 7 |
1952 | 61.5% 6,207 | 38.4% 3,875 | 0.0% 4 |
1948 | 49.4% 4,472 | 48.5% 4,391 | 2.1% 194 |
1944 | 55.8% 5,191 | 43.0% 4,003 | 1.2% 111 |
1940 | 51.2% 6,061 | 47.5% 5,625 | 1.2% 147 |
1936 | 44.4% 5,060 | 54.1% 6,168 | 1.5% 170 |
1932 | 40.2% 4,194 | 58.4% 6,100 | 1.4% 147 |
1928 | 60.2% 5,851 | 39.1% 3,806 | 0.7% 69 |
1924 | 51.5% 4,607 | 45.9% 4,103 | 2.6% 235 |
1920 | 54.2% 4,720 | 42.5% 3,707 | 3.3% 287 |
1916 | 44.5% 4,481 | 50.1% 5,052 | 5.4% 543 |
1912 | 30.4% 1,617 | 47.9% 2,550 | 21.7% 1,153 |
1908 | 47.2% 2,197 | 48.4% 2,253 | 4.5% 209 |
1904 | 50.6% 1,969 | 44.0% 1,712 | 5.3% 207 |
1900 | 48.0% 1,961 | 49.5% 2,021 | 2.5% 101 |
1896 | 49.4% 1,972 | 48.8% 1,948 | 1.8% 71 |
1892 | 45.3% 1,523 | 46.8% 1,572 | 7.9% 267 |
See also
- National Register of Historic Places listings in Lawrence County, Illinois
References
^ ab "State & County QuickFacts". United States Census Bureau. Archived from the original on July 13, 2011. Retrieved July 6, 2014..mw-parser-output cite.citation{font-style:inherit}.mw-parser-output .citation q{quotes:"""""""'""'"}.mw-parser-output .citation .cs1-lock-free a{background:url("//upload.wikimedia.org/wikipedia/commons/thumb/6/65/Lock-green.svg/9px-Lock-green.svg.png")no-repeat;background-position:right .1em center}.mw-parser-output .citation .cs1-lock-limited a,.mw-parser-output .citation .cs1-lock-registration a{background:url("//upload.wikimedia.org/wikipedia/commons/thumb/d/d6/Lock-gray-alt-2.svg/9px-Lock-gray-alt-2.svg.png")no-repeat;background-position:right .1em center}.mw-parser-output .citation .cs1-lock-subscription a{background:url("//upload.wikimedia.org/wikipedia/commons/thumb/a/aa/Lock-red-alt-2.svg/9px-Lock-red-alt-2.svg.png")no-repeat;background-position:right .1em center}.mw-parser-output .cs1-subscription,.mw-parser-output .cs1-registration{color:#555}.mw-parser-output .cs1-subscription span,.mw-parser-output .cs1-registration span{border-bottom:1px dotted;cursor:help}.mw-parser-output .cs1-ws-icon a{background:url("//upload.wikimedia.org/wikipedia/commons/thumb/4/4c/Wikisource-logo.svg/12px-Wikisource-logo.svg.png")no-repeat;background-position:right .1em center}.mw-parser-output code.cs1-code{color:inherit;background:inherit;border:inherit;padding:inherit}.mw-parser-output .cs1-hidden-error{display:none;font-size:100%}.mw-parser-output .cs1-visible-error{font-size:100%}.mw-parser-output .cs1-maint{display:none;color:#33aa33;margin-left:0.3em}.mw-parser-output .cs1-subscription,.mw-parser-output .cs1-registration,.mw-parser-output .cs1-format{font-size:95%}.mw-parser-output .cs1-kern-left,.mw-parser-output .cs1-kern-wl-left{padding-left:0.2em}.mw-parser-output .cs1-kern-right,.mw-parser-output .cs1-kern-wl-right{padding-right:0.2em}
^ "Find a County". National Association of Counties. Retrieved 2011-06-07.
^ Gannett, Henry (1905). The Origin of Certain Place Names in the United States. U.S. Government Printing Office. p. 182.
^ ab "Population, Housing Units, Area, and Density: 2010 - County". United States Census Bureau. Retrieved 2015-07-12.
^ ab "Monthly Averages for Lawrenceville, Illinois". The Weather Channel. Retrieved 2011-01-27.
^ "Population and Housing Unit Estimates". Retrieved June 9, 2017.
^ "U.S. Decennial Census". United States Census Bureau. Retrieved July 6, 2014.
^ "Historical Census Browser". University of Virginia Library. Retrieved July 6, 2014.
^ "Population of Counties by Decennial Census: 1900 to 1990". United States Census Bureau. Retrieved July 6, 2014.
^ "Census 2000 PHC-T-4. Ranking Tables for Counties: 1990 and 2000" (PDF). United States Census Bureau. Retrieved July 6, 2014.
^ abc "DP-1 Profile of General Population and Housing Characteristics: 2010 Demographic Profile Data". United States Census Bureau. Retrieved 2015-07-12.
^ "DP02 SELECTED SOCIAL CHARACTERISTICS IN THE UNITED STATES – 2006-2010 American Community Survey 5-Year Estimates". United States Census Bureau. Retrieved 2015-07-12.
^ "DP03 SELECTED ECONOMIC CHARACTERISTICS – 2006-2010 American Community Survey 5-Year Estimates". United States Census Bureau. Retrieved 2015-07-12.
^ Cohn, Nate; ‘Demographic Shift: Southern Whites’ Loyalty to G.O.P. Nearing That of Blacks to Democrats’, New York Times, April 24, 2014
^ Leip, David. "Dave Leip's Atlas of U.S. Presidential Elections". uselectionatlas.org. Retrieved 2018-11-09.
External links
- Lawrence County official site
- Lawrence County Fact Sheet, Illinois State Archives
- Blue Star Emergency Medical Services Official Site
Places adjacent to Lawrence County, Illinois | ||||||||||
|---|---|---|---|---|---|---|---|---|---|---|
| ||||||||||
Municipalities and communities of Lawrence County, Illinois, United States | ||
|---|---|---|
County seat: Lawrenceville | ||
| Cities |
| |
| Village |
| |
| Townships |
| |
| Unincorporated communities |
| |
Springfield (capital) | ||
| Topics |
|  Seal of Illinois |
| Regions |
| |
| Municipalities |
| |
| Counties |
| |
Southern Illinois | ||
|---|---|---|
| Counties |
|  |
| Mid-sized cities (25,000+) |
| |
| Small Cities (10,000-25,000) |
| |
| Small Cities (5,000-10,000) |
| |
| Interstates |
| |
| Airports/Military bases |
| |
| Universities |
| |
| Colleges |
| |
| Sports teams based in the Southern Illinois |
| |
Coordinates: 38°43′N 87°44′W / 38.72°N 87.73°W / 38.72; -87.73


